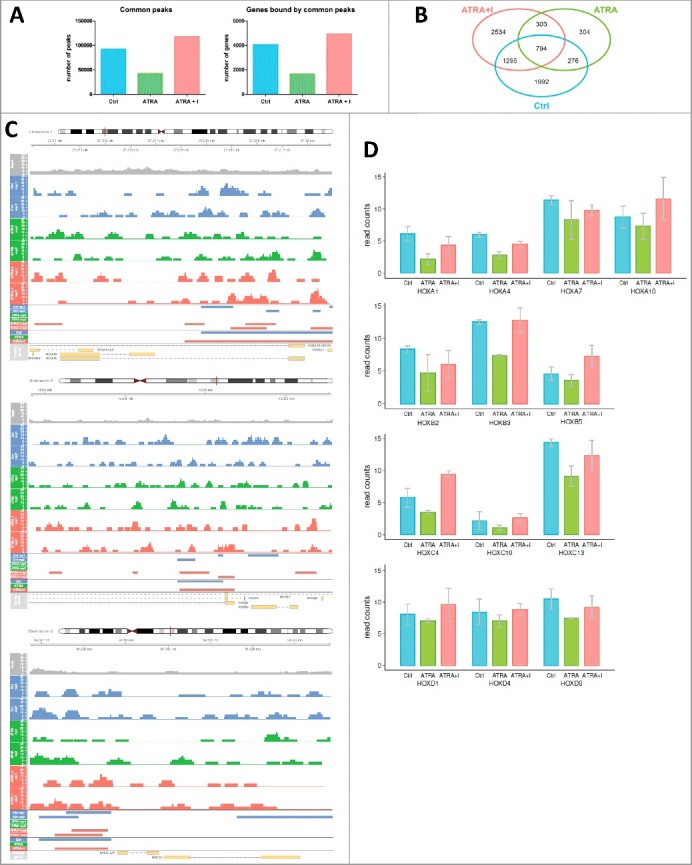
Figure 4.

Enrichment of histone mark H3K27me3 on HOX gene promoters upon changes in JMJD3 expression.
NB4 cells were treated with ATRA (1 µM) alone or in combination with GSK-J4 (10 µM, I) After 8 h of treatment, ChIP was performed with an antibody against the repressive histone mark H3K27me3, followed by NGS. A) Raw data after alignment to hg19 were used for peak calling analysis (MACS2 tool). Peaks present in all replicates were then assigned to gene promoters (+/- 2 kb from the TSS) (peaks that are present in both replicates were obtained by merging peaks from replicates that were less than 2 kb apart from each other). The number of common peaks (peaks called in both replicates of each sample) was counted across the whole genome. The number of genes with a peak in their promoter region less than 2 kb from the TSS was counted across the whole genome. Quantification of protein level was performed using Image Studio Digits Ver. 5.0. Protein levels of modified histones were normalized to total H3 level and to the control sample. B) Intersections of common peaks between different samples were detected. In particular, the intersection between the Ctrl and ATRA+I samples represents genes that are regulated by histone demethylation. C) H3K27me3 binding at HOXA10, HOXB3 and HOXC9 promoter sites. The figure represents the genome region, and the aligned data tracks are the input (used as a background), six tracks of MACS2 output (two replicates (rep1, rep2)) of the untreated sample (Ctrl), ATRA-treated sample (ATRA) and ATRA- and GSK-J4-treated sample (ATRA+I)) and two tracks of final peaks called. The first groups of peaks were called using MACS2 peak calling, and the second group of peaks are common peaks obtained by merging peaks from replicates that were less than 2 kb apart from each other. D) Raw data after alignment to hg19 were used for analysis based on gene promoter read counts in gene promoters defined as +/− 500 bp from the TSS. Read counts were extended to the fragment length (300 bp) and normalized by the library size. Graphs show medians from two independent replicates. The read count analysis shows a decrease in H3K27me3 binding at HOX promoter sites in ATRAtreated samples compared with Ctrl (untreated) samples. This pattern was reversed after co-treatment with GSK-J4 (ATRA+I).
