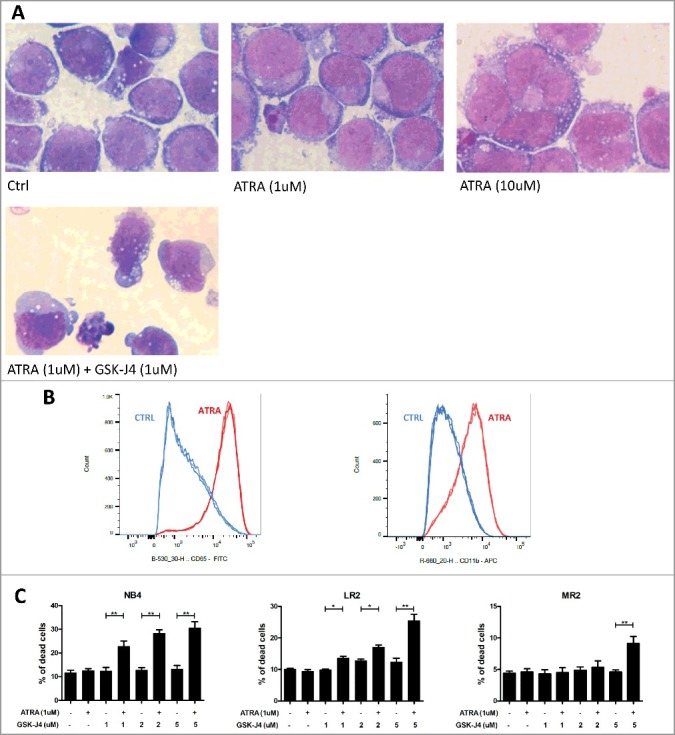
Figure 5.

Determination of differentiation and apoptotic status of APL cells upon ATRA and ATRA/GSK-J4 combination.
A) NB4 cells were treated with ATRA (1 µM, 10 µM) alone or in combination with GSK-J4 (1 µM) for 48 h. Cell cytoskeletons were visualized by May-Grünwald Giemsa-Romanowsky staining. B) NB4 cell line was treated with ATRA (1uM) for 48 h. Cells well stained with antibodies against CD65 (median of fluorescence B-530_30-H: CTRL – 1618, 1705, 1558, ATRA – 23 151, 23 482, 23 876) and CD11b (median of fluorescence R = 660_20-H: CTRL – 1249, 1256, 1330, ATRA – 5029, 4903, 4965). C) Cell lines (NB4, LR2, MR2) were treated with ATRA (1 µM) and GSK-J4 (1 µM, 2 µM, 5 µM) alone or in combination. After 48 h of treatment, the cells were stained with Annexin V/PI, and the percentage of dead cells was measured using flow cytometry. Significant changes were detected between ATRA-treated and combination-treated cell lines (NB4, LR2, MR2). Graphs represent the arithmetic mean calculated from two biological replicates (each biological replicate consists of three technical replicates).
