
Figure 2.
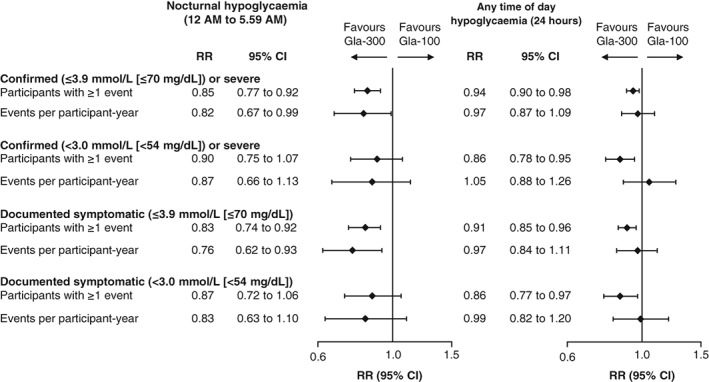
Percentage of participants with ≥1 hypoglycaemic event and annualized event rate (events per participant‐year) over the 12‐month treatment period (safety population). RR, relative risk for percentage of participants with ≥1 event, rate ratio for annualized event rates