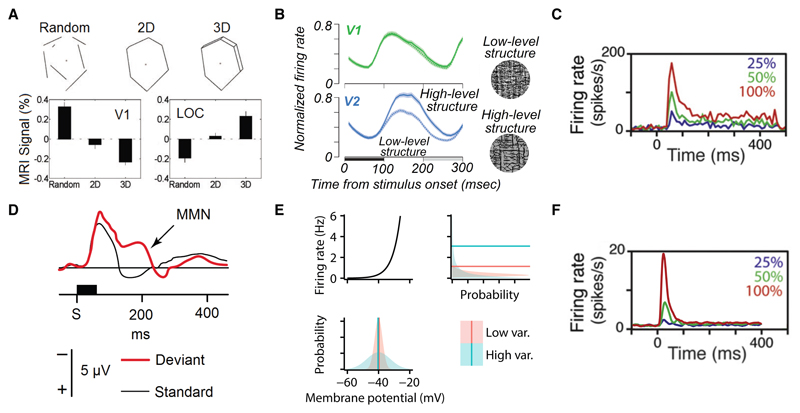
Figure 2.
A. Stimuli having progressively more high-level structure (top) give rise to less BOLD activity in human V1 (bottom left), and more activity in higher-level visual areas (lateral occipital complex, LOC, bottom right). Adapted from [25]. B. Stimuli (right) matching low-level (frequency structure) and high-level structure in natural images [26, 27] evoke near-identical average responses in macaque V1 (top left; if anything, the stimuli with higher-level structure gave slightly higher responses), despite activity in V2 increasing substantially (bottom left). The horizontal black bar denotes stimulus presentation, the grey bar is a noise control. Adapted from [27]. C. Stimulus-induced transients in macaque V1 responses at the onset of a static visual stimulus presented between 0–400 ms. The magnitude of the transient scales with contrast (colour code). Adapted from [28]. D. Mismatch negativity (MMN) in human auditory cortex. Two types of auditory tones were presented, a standard stimulus at 1000 Hz that was presented 80% of the time, and a deviant stimulus at a variety of frequencies that was presented 20% of the time. The event-related potentials for the two stimuli (black: standard 1000 Hz, red: deviant 1032 Hz) diverge around 200 ms after stimulus onset (S, horizontal black bar). Adapted from [29] using data from [30]. E. Nonlinear signal transformations result in changes in mean output even when only the variance of the input changes. Bottom: two membrane potential distributions with identical means, but one with less variability (red) than the other (blue). Top-left: firing rate nonlinearity mapping from membrane potential (x-axis) to firing rate (y-axis). Right: the resulting distributions over firing rates, and their means (horizontal lines). Notably, while the mode of the broader (blue) distribution is smaller than the mode of the narrower (red) distribution, the long tail of the broader distribution increases the mean above that of the red distribution. F. Stimulus-induced transients in a sampling-based direct variable coding model of V1 using non-equilibrium dynamics. The magnitude of the transient scales with contrast (colour code). Adapted from [31], c.f. panel C.

