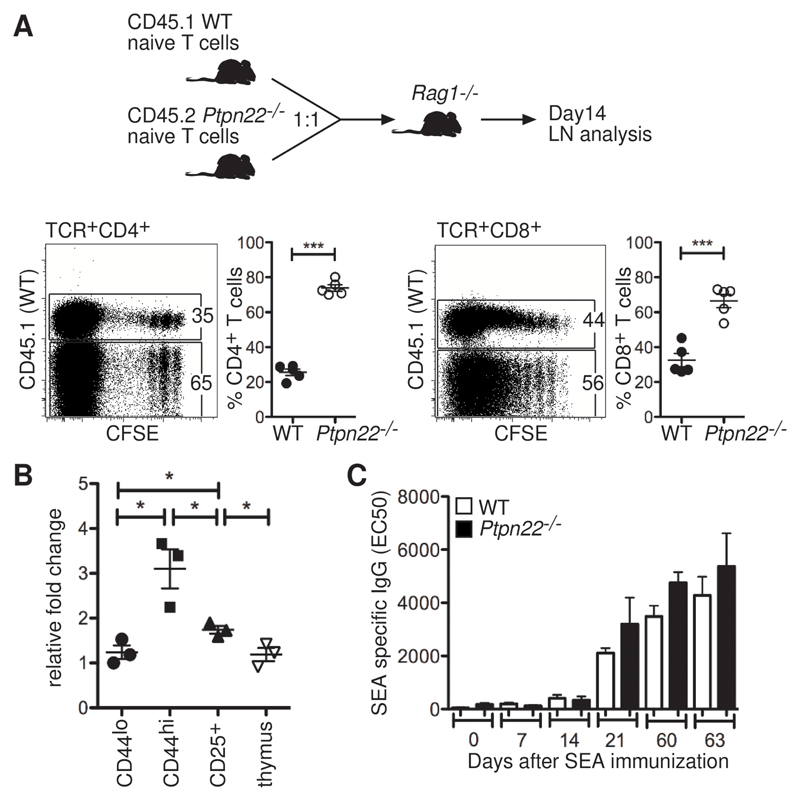
Fig. 1. Ptpn22-/- T cells show greater expansion in numbers than do WT cells in vivo, but they do not have increased TH2 helper activity.
(A) Naïve T cells purified from WT (CD45.1+) and Ptpn22-/- (CD45.2+) lymph nodes were labeled with CFSE and injected i.v. into Rag1-/- recipient mice (n = 5) at a 1:1 ratio (4 x 10⁶ cells/mouse in total). The abundances of CD44 and CD25 on the surface of transferred T cells were comparable before injection, and the proportions of WT (CD45.1+) and Ptpn22-/- (CD45.2+) cells in the blood of recipients were monitored on day 1 (WT = 53 ± 8% and Ptpn22-/- = 43 ± 9%; values are means ± SD). After 14 days, the lymph nodes of recipient mice were analyzed by flow cytometry for the proportions of CD45.1+ and CD45.2+ T cells. Representative dot plots and ratios of WT (CD45.1+) to Ptpn22-/- (CD45.1-) cells are shown. Each point represents an individual animal; data are means ± SEM. Results are representative of two individual experiments. (B) Amounts of PTPN22 mRNA were assessed in CD4+ T cells from lymph nodes of WT mice that were sorted to give CD25-CD44lo, CD25-CD44hi, and CD25+ cells, as well as in total thymus cells. Values are expressed relative to the amounts of Hprt mRNA. Each point represents an individual animal (n = 3 mice). (C) Groups of WT and Ptpn22-/- mice (n = 5 mice of each genotype) were immunized with 2000 S. mansoni eggs on day 0, followed by a boost of 1000 eggs on day 49. Sera from tail bleeds were assessed for SEA-specific IgG at various time points by ELISA. Graph represents the mean EC50 values values ± SEM. *P < 0.05, ***P < 0.005.

