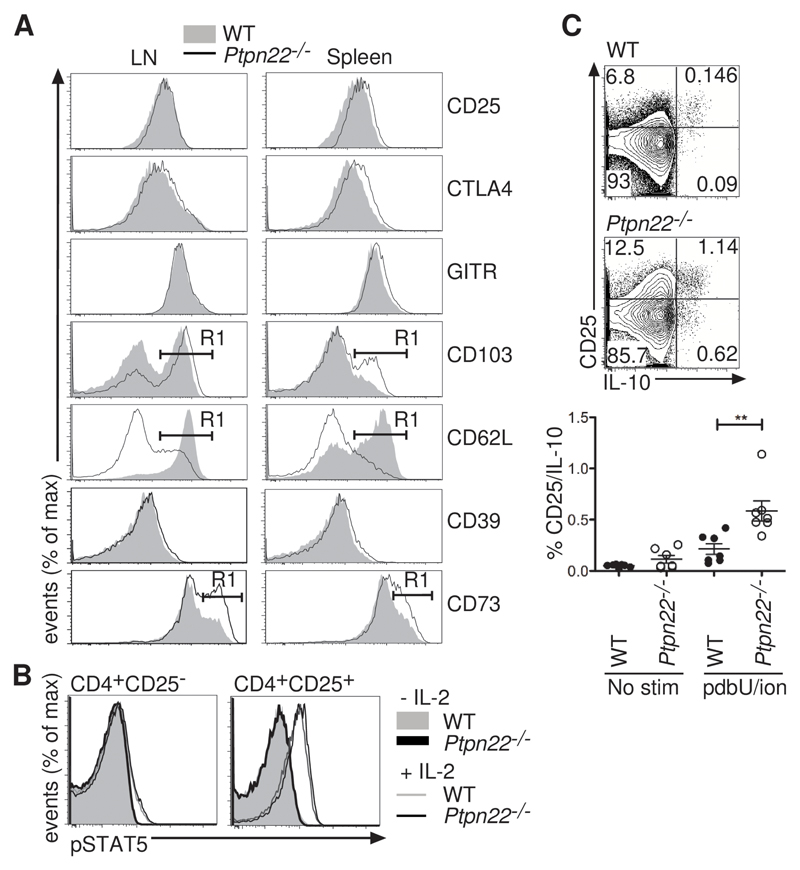
Fig. 5. Ptpn22-/- Tregs have an activated phenotype.
(A) CD4+FoxP3+CD25+ cells from lymph nodes and spleen were stained with antibodies to detect surface CD25, CD103, CD62L, CD39, and CD73 as well as intracellular GITR and CTLA-4 by flow cytometry. The %±SD of lymph node and splenic Tregs positive for the markers CD103, CD62L and CD73 as indicated by gate R1 (shown on histogram) is given in Table S1. Representative histograms of 5 mice from each group are shown. (B) The abundance of pSTAT5 was assessed in WT and Ptpn22-/- Tregs after stimulation with IL-2. WT CD4+CD45.1+ cells were mixed in a 1:1 ratio with CD4+CD45.2+ Ptpn22-/- cells, and were stimulated with IL-2 (1 ng/ml) for 15 min before being fixed and stained for CD45.1, CD45.2, CD4, CD25, and pSTAT5. Representative histograms show the abundance of pSTAT5 in WT and Ptpn22-/- CD25- and CD25+ cells with (open histogram) and without (filled histogram) IL-2. Data are representative of 2 experiments. (C) IL-10 production from CD4+CD25+ WT and Ptpn22-/- Tregs was measured after incubation of lymph node cells without (no stim) or with PDBU and ionomycin for 4 hours. Representative plots of stimulated cells are shown, and the graph represents the percentages of IL-10+CD25+ cells from individual animals (n = 7 mice, **P < 0.005).

