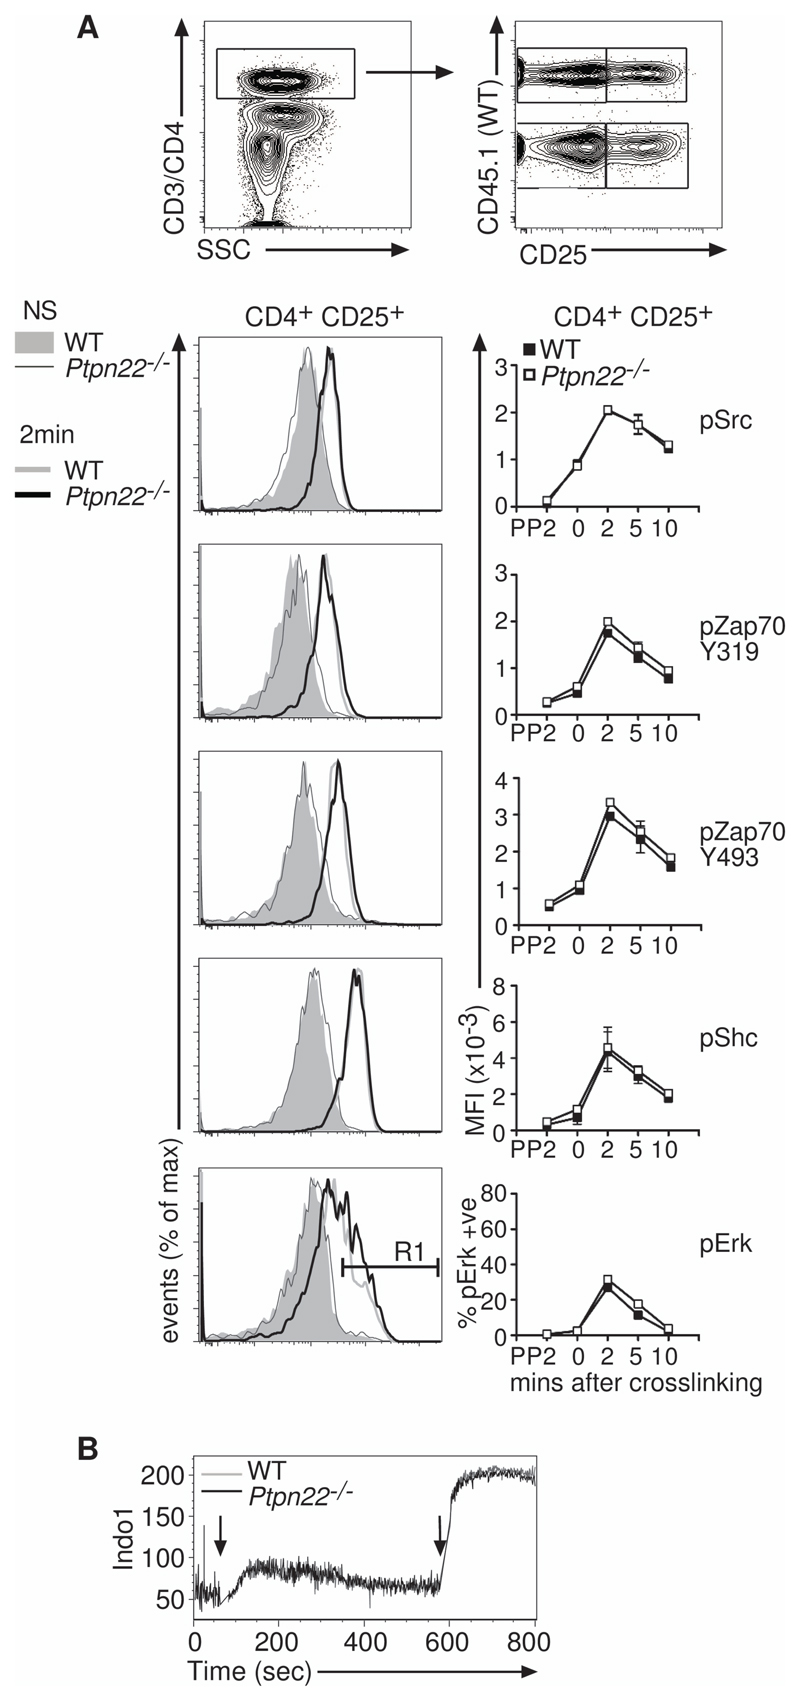
Fig. 6. Ptpn22-/- Tregs show no enhancement of signaling after TCR stimulation.
(A) WT CD45.1+ lymph node cells were mixed 1:1 with CD45.2+ Ptpn22-/- lymph node cells and stimulated with biotinylated anti-CD3 and anti-CD4 antibodies, which were crosslinked with streptavidin-PerCP. Cells were fixed, permeabilized, and stained with anti-CD25, anti-CD45.1, anti-CD45.2, and phospho-specific antibodies, as indicated. Example dot plots indicating the gating strategy and representative histograms show the data 2 mins after cross-linking. Data are representative of 3 individual experiments. (B) Ca2+ flux in WT and Ptpn22-/- CD4+CD25+ Tregs after cross-linking of CD3 and CD4 was measured by flow cytometry. INDO-1–loaded WT (CD45.1+) and Ptpn22-/- (CD45.2+) cells were mixed 1:1 and labeled with biotinylated anti-CD3 and anti-CD4 antibodies, which were crosslinked by the addition of streptavidin (first arrow). After 10 mins, ionomycin was added to the tubes to elicit maximum Ca2+ flux. Representative traces for Ca2+ flux are shown from one of two replicate experiments.

