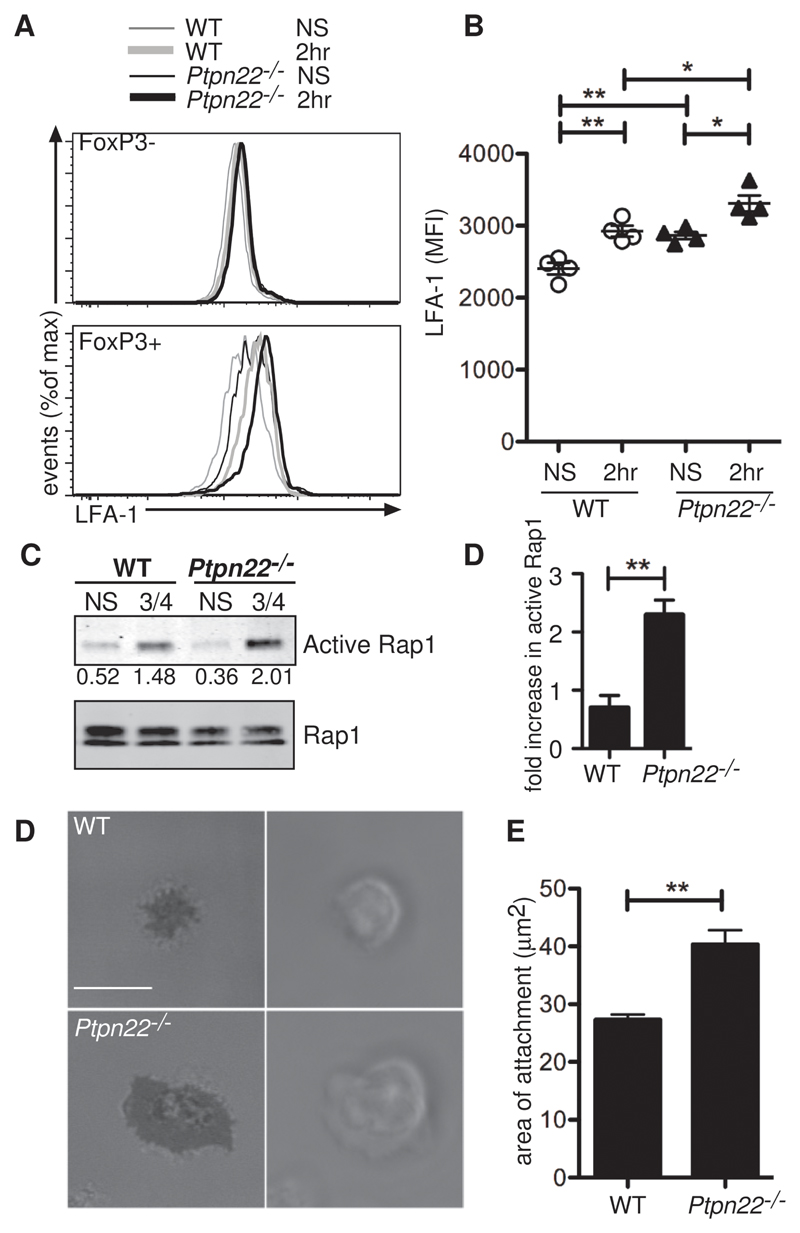
Fig. 7. Ptpn22-/- Tregs have increased amounts of LFA1 and make larger areas of contact with surface bound ICAM1 than do WT Tregs.
(A and B) WT and Ptpn22-/- CD4+ cells were stained with biotinylated anti-CD3 and anti-CD4 antibodies, which were then cross-linked with streptavidin for 2 hours at 37°C, and then cells were assessed by flow cytometry for LFA1 abundance. Tregs were identified by detection of FoxP3 after staining for LFA1. (A) Representative histograms show LFA1 abundance before and after cross-linking of CD3 and CD4 in both FoxP3- and FoxP3+ T cells. (B) MFIs of LFA1 in FoxP3+ cells are represented graphically with each point representing an individual animal (n = 4 mice). (C) In vitro–derived WT and Ptpn22-/- CD4+ effector T cells were incubated with biotinylated anti-CD3 and anti-CD4 antibodies, which were cross-linked with avidin for 5 min at 37°C, and then cells were assessed for active Rap1 by immunoprecipitation. Normalized band intensities are indicated. Data are representative of 3 independent experiments. (D) Quantification of data shown in (C). **P < 0.005. (E) CD4+CD25+ cells were sorted from the lymph nodes of WT and Ptpn22-/- mice and were allowed to adhere to ICAM1-coated slides before being visualized by IRM. (Scale bar: 10 μm). (F) Quantification of the area of contact made by the Tregs is shown. Bars represent SEM. Data are representative of 3 individual animals of each genotype and two separate experiments.

