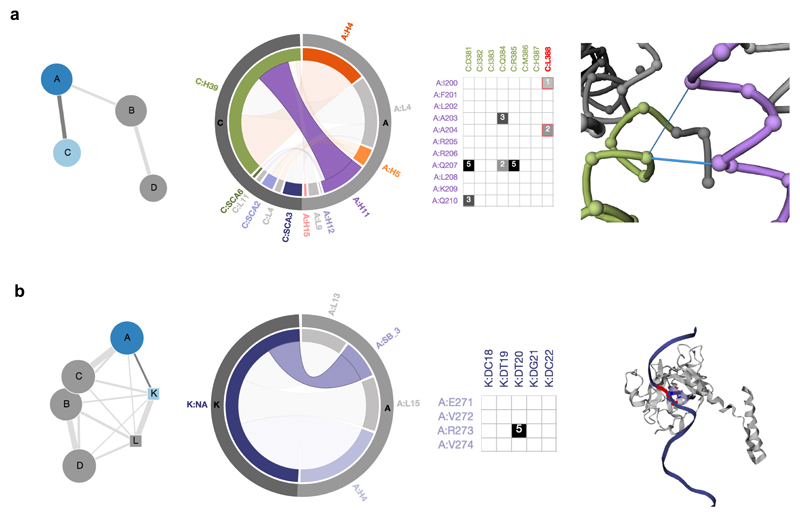
Figure 3.
Visualization of protein-protein and protein-DNA interaction interfaces. a, The biomolecular complex network of the Adenosine A2a-mini-Gs structure (5G53) with four chains as nodes and interactions between them as edges is seen with chains A (A2a adenosine receptor; dark blue) and C (mini Gαs protein; light blue) highlighted. The chord plot of contacts between chains A (outer arc in light grey) and C (outer arc in dark grey) of the complex is seen next to it. The inner arcs show the secondary structures in their respective colors with loops as light grey. The selected chord shows the contacts between Helix 39 of the G protein (green) and Helix 11 of the receptor (purple). The residue contact matrix of the interface is also shown along with a network view of the receptor-G protein interaction interface (right). Positions that are mutated in pseudo-hypoparathyroidism (L388 G.H5.20; superscript denotes common G protein numbering system36) are shown in the network view and highlighted. Contacts are represented as blue edges and nodes are represented as spheres (using the Cα atom co-ordinates of the residues). b, The biomolecular complex network of p53 in complex with DNA (4MZR) with chain A (p53; circle, dark blue) and chain K (DNA; square, light blue) is highlighted. The selected chord highlights the contacts between Sheet B3 of p53 (chain A; light grey, outer arc) with DNA (Chain K; dark grey, outer arc). The residue contact matrix shows that there are five atomic contacts between R273 of p53 and T20 of the DNA strand. The 3D structure view of the protein-DNA complex with position R273 (red) that forms a part of the interaction interface and whose mutation is implicated in cancer is highlighted on the right.

