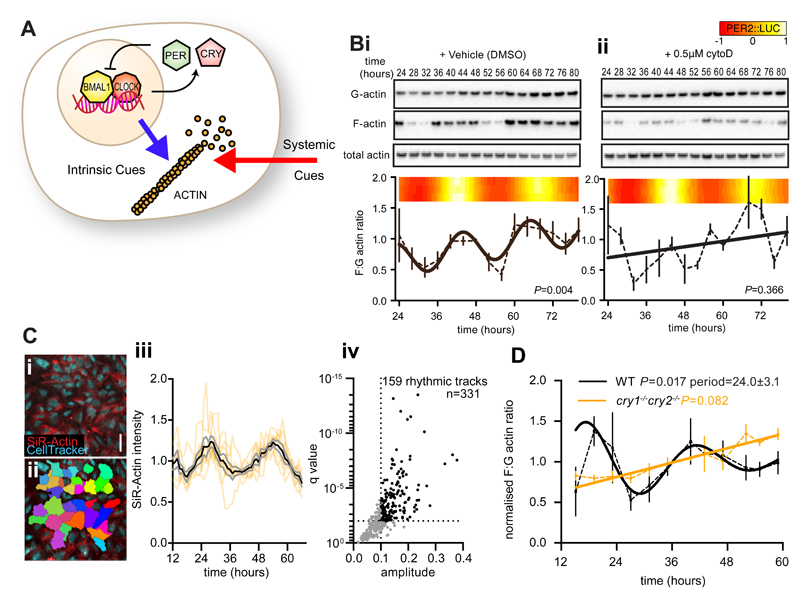
Fig. 2. CRY-dependent cell-intrinsic rhythms in actin polymerisation.
A. Schematic depicting rhythms in actin polymerisation, which may be cell intrinsic (blue arrow; driven by circadian gene expression) in addition to systemic cues (red arrow). B. Immunoblots using anti-actin antibody against fractionated and total protein from PER2::LUC fibroblasts at the indicated time after synchronisation in the presence of DMSO (i) or cytoD (0.5 μM) (ii). F:G actin ratio is quantified below, with best-fit curves from a comparison of fits (n=3 mean±Standard Error (SEM)). 3 parallel bioluminescent measurements (heat map) are included as a marker for the circadian clock. As G actin was in excess, exposures between western panels are not equivalent. C. Live cell recordings of actin abundance (SiR-actin) in cells labelled with Celltracker Green (i,ii, scale bar =100 μm). iii. SiR-actin intensity over time for 8 individual tracks (orange lines) with mean (black) ±SEM (grey) overlayed. Tracks with a circadian harmonic regression FDR (q value) <1% and amplitude >10% of the mean are highlighted and quantified (iv). D. F:G actin ratios from wild type (WT, black line) or cry1-/- cry2-/- (orange line) fibroblasts at the indicated time after synchronisation, with best-fit curves from a comparison of fits (n=3, mean±SEM, RAIN p-values indicated).

