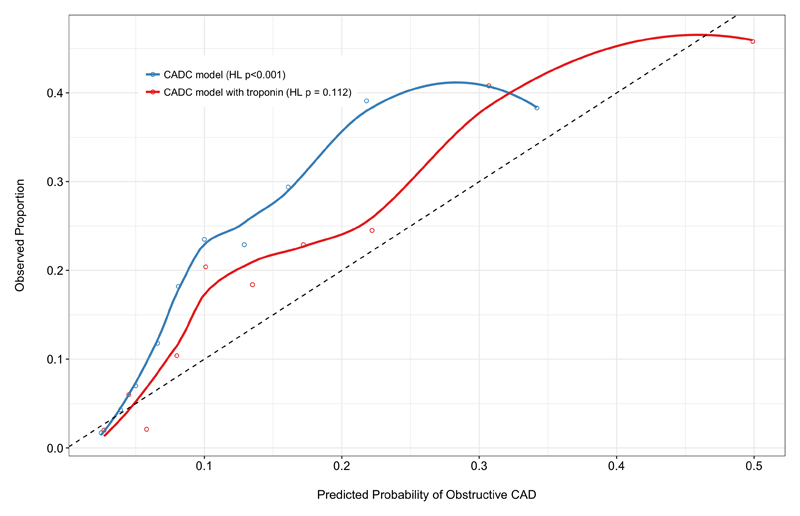
Figure 2. Model calibration within the external validation cohort.
Plot demonstrates poor calibration of predicted probability vs observed proportion of obstructive coronary artery disease using the established CADC model (blue). Good model calibration is demonstrated within the validation cohort following the addition of troponin to the CADC model (red). The dashed line represents perfect calibration.
CADC, Coronary Artery Disease Consortium; HL, Hosmer-Lemeshow.

