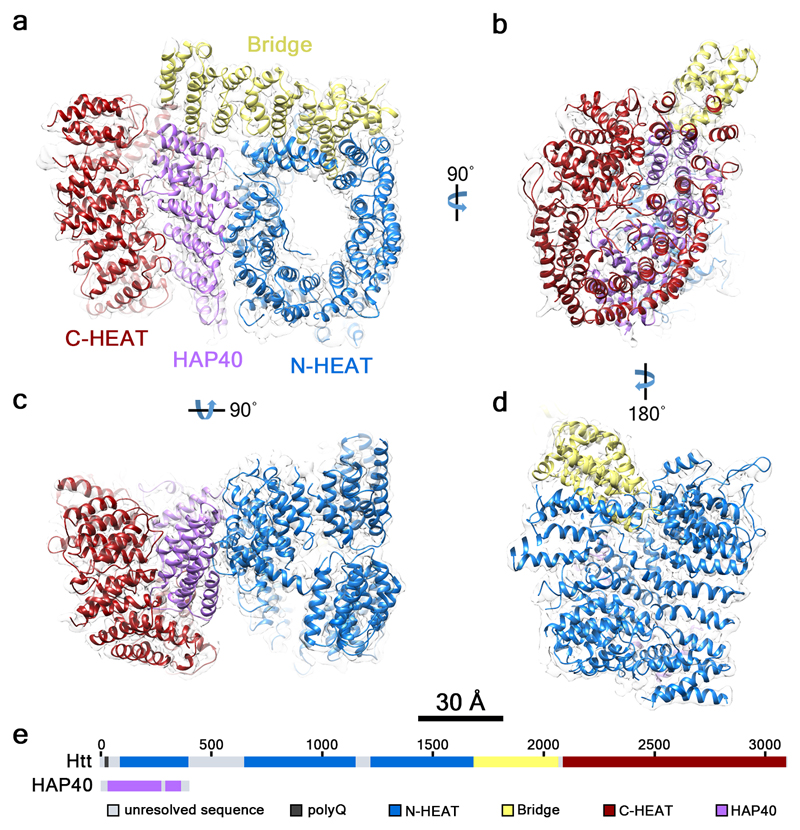
Fig. 2. Architecture of the Htt-HAP40 complex.
The reconstructed density map filtered according to local resolution is shown as a translucent surface. The atomic model is superimposed in ribbon representation, with domains color-coded as follows: Htt N-HEAT domain, blue; Htt bridge domain, yellow; Htt C-HEAT domain, maroon; HAP40, purple. a, b, c, d show different views of the complex as indicated. e, Schematic domain organization of Htt and HAP40.

