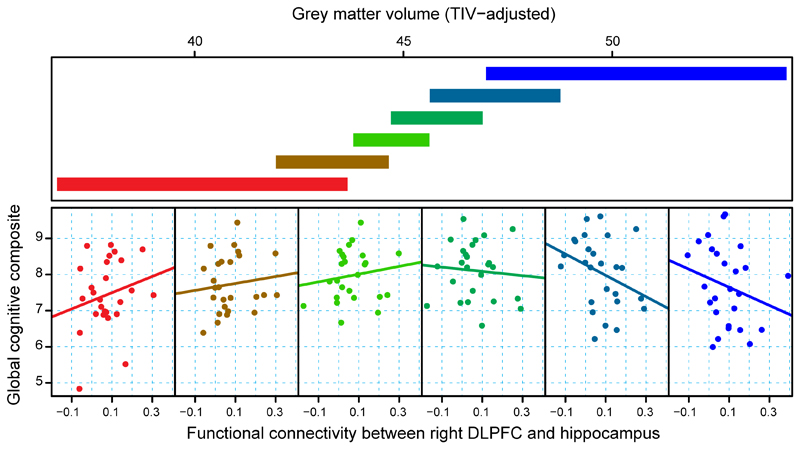
Figure 2. Cross-sectional Compensation in Huntington’s Disease.
Conditioning plot which illustrates global cognitive performance as a function of connectivity between the right dorsolateral prefrontal cortex and the left hippocampus, conditional on a structural measure of disease load (grey matter volume). The upper panel depicts overlapping ranges of structural disease load that determine the subsample for which observed points are plotted for each associated scatterplot. A linear regression line is fit within each panel. The extreme left scatterplot (red) includes the smallest brain volume (highest structural disease load) range from the data set (lower left red slab). The extreme right scatterplot (blue) includes the largest volume (lowest disease load) range from the data set (upper right blue slab). Figure originally published in EBioMedicine, 2015: Kloppel S, Gregory S et al., Compensation in Preclinical Huntington's Disease: Evidence From the Track-On HD Study. Ref 40.

