
Figure 3. Hybrid Th1/17 Cells Are Metabolically Distinct from Th1 and Th17 Cells and Depend upon Glutaminolysis.
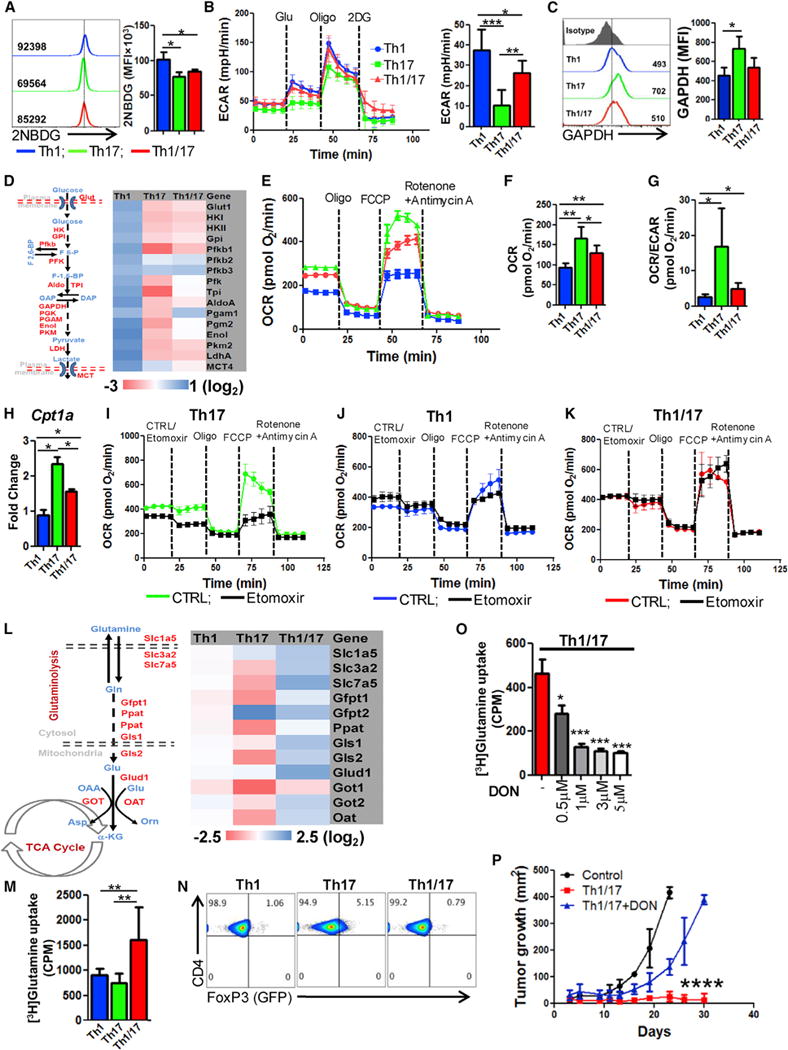
(A) The ex vivo programmed Th1, Th17, and Th1/17 cells were used to determine glucose uptake using 2NBDG. Adjacent bar diagram represents the cumulative data of mean fluorescence intensity (MFI) from three independent experiments.
(B) ECAR time course in response to glucose, oligomycin, and 2DG (left panel). Adjacent bar shows ECAR levels after glucose addition.
(C) Intracellular expression of GAPDH by FACS. Adjacent bar represents cumulative data from three experiments.
(D) Glycolysis associated genes using qPCR.
(E–G) Oxygen consumption rate (OCR) under basal condition and in response to indicated mitochondrial inhibitors. Graphs representing time course (E), basal OCR (F), and OCR/ECAR ratio (G).
(H) Expression of CTP1a using qPCR.
(I–K) OCR in presence or absence of etomoxir (200 μM) followed by the addition of various mitochondrial inhibitors as indicated in Th17 (I), Th1 (J), and Th1/17 (K).
(L) Expression of various glutaminolysis associated genes using qPCR.
(M) Uptake of radiolabelled glutamine that was measured in count per minute (CPM). Data are mean of four replicate samples from the three repeat experiments.
(N) FoxP3 expression in FoxP3-GFP knockin CD4+ T cells differentiated to Th1, Th17, and Th1/17 phenotype.
(O) Uptake of radiolabelled glutamine in Th1/17 cells cultured in presence of different conc. of DON. Representative data from one of three independent experiments are shown.
(P) TRP-1 Th1/17 cells differentiated in the presence of either vehicle control (DMSO) or DON (3 μM) were adoptively transferred (0.5 × 10⁶) in 9 days s.c. established B16-F10 melanoma tumor-bearing mice, and tumor growth was measured. Results for tumor area are the mean of measurements ± SD, from at least four mice per group. *p < 0.05, **p < 0.01, and ***p < 0.005. Also see Figure S4.