
Figure 6. High Foxo1 Activity in Th1/17 Cell Contributes to Enhanced Tumor Control.
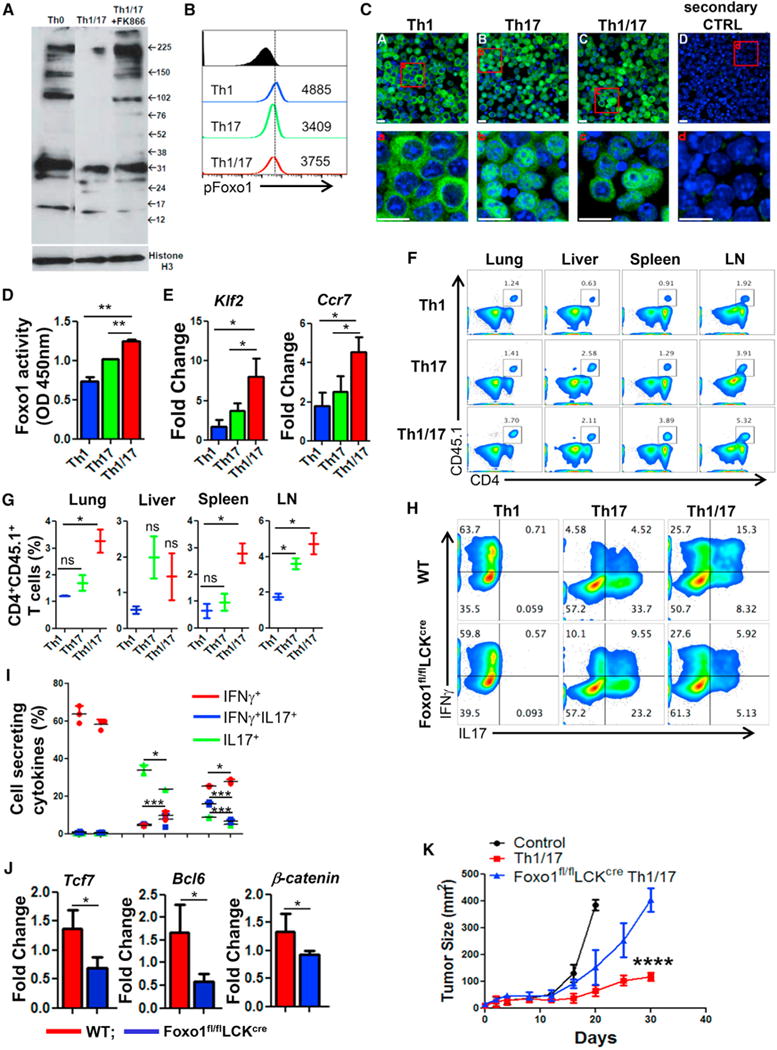
(A) Determination of global acetylation of nuclear protein in Th0, Th1/17, and Th1/17+FK866 cells using western blot. Membrane was blotted for Histone H3 (bottom panel) for loading correction.
(B) Flow cytometry analysis of phosphorylated Foxo1 (S256) in Th1, Th17, and Th1/17 cells. Data are representative of three independent experiments.
(C) Confocal images of the indicated cell stained with Foxo1 (in green). Nuclei were stained with DAPI (in blue). Lower panels show the magnified images of the cells in the red box drawn in the upper panels. Scale bar, 10 μm.
(D) ELISA-based determination of Foxo1 activity in Th1, Th17, and Th1/17 cells. Data are means ± SD of two samples from one representative experiment out of three.
(E) qPCR analysis of the expression of Klf2 and Ccr7 in differentiated Th1, Th17, and Th1/17 cells.
(F and G) Flow cytometric analysis (F) and frequency (G) of donor cells (Ly5.1+) retrieved from the lung, liver, spleen, and lymph nodes 24 hr after adoptive transfer of Th1, Th17, and Th1/17 cells into wild-type mice (Ly5.2+).
(H–J) WT or Foxo1fl/flLckcre CD4+T cells differentiated to Th1, Th17, and Th1/17 cells were used to determine (H) intracellular cytokine secretion, (I) frequency of cells secreting cytokines, and (J) stemness-associated genes using qPCR.
(K) C57BL/6 mice (n = 4 mice/group) with subcutaneously established B16-F10 melanoma for 9 days were either kept untreated or adoptively transferred with 0.5 × 10⁶ TRP-1 TCR transduced Th1/17 cells from either WT or Foxo1fl/flLckcre mice. The tumor growth curve from various groups of recipient mice is shown. Data are representative of three independent experiment in (H)–(J) and from two independent experiments, with similar result in (I). *p < 0.05, **p < 0.01, ***p < 0.005, and ****p < 0.0001. Also see Figure S6.