
Figure 7. Inverse Correlation between CD38 and NAD+ Regulates Anti-Tumor Property of T Cells.
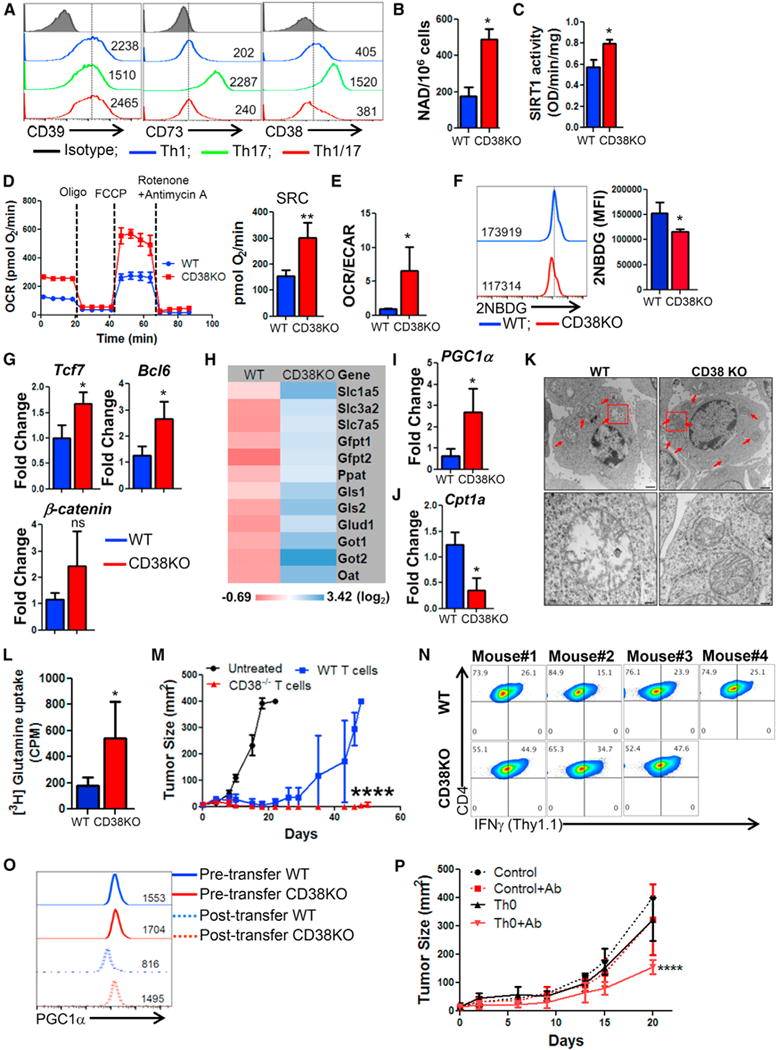
(A) Purified CD4+ T cells differentiated to Th1, Th17, and Th1/17 were used for determining the relative expression of cell surface molecules involved in canonical and non-canonical adenosinergic pathways. Splenic CD4+ T cells from C57BL/6 WT and CD38KO mice after 3 days of TCR activation were used to determine (B) intracellular NAD+ levels and (C) nuclear Sirt1 activity. TCR activated WT and CD38KO CD4+ T cells were used for determining (D) time course of OCR (left panel) and SRC (right panel), and (E) basal OCR/ECAR ratio. (F) Glucose uptake by using fluorescent-labeled glucose analog 2-NBDG. Adjacent bar diagram represents the cumulative data of mean fluorescence intensity (MFI) from three independent experiments. (G–J) qPCR analysis of the expression of (G) various stemness-associated genes, (H) glutaminolysis-associated genes, (I) PGC1α expression, and (J) Cpt1a expression. (K) Transmission electron microscopy of activated WT and CD38KO CD4+ T cells. Lower panels show the magnified images of the cells in the red box drawn in the upper panels. Scale bar, 1 μM (upper panel) and 200 nM (lower panel). (L) Uptake of radiolabelled glutamine measured in count per minute (CPM) is presented from one of two independent experiments. (M) Anti-tumor ability upon adoptive transfer of 0.5 × 10⁶ tyrosinase reactive TIL1383I TCR transduced CD4+ T cells from either C57BL/6 IFNγThy1.1 or CD38KO-IFNγThy1.1 mice to HLA-A+ mice (N = 8/group) with s.c. established B16-F10-HLA-A2+ murine melanoma cells. Data from one of the two experiments with similar results is shown. (N) Tumor infiltrating lymphocytes from the treated mice (as in M) were retrieved, and expression of Thy1.1 (≈IFN-γ) was evaluated in CD4+ Vb12+ cells using flow cytometry. (O) Flow cytometry analysis for intranuclear expression of PGC1α was performed using the WT or CD38KO CD4+ T cell retrieved 24 hr after injection to the ascites of EL-4 ascites tumor-bearing mice (n = 2). PGC1α expression pre- and post-injection is shown. (P) C57BL/6 mice (n = 4–5 mice/group) with 9 days subcutaneously established B16-F10 melanoma tumor were either kept untreated or adoptively transferred with 1 × 10⁶ TRP-1 CD4+ T cells (Th0). Group of mice that received T cells were either kept untreated or injected with anti-CD38 Ab (50 μg/mouse; i.p.) three times in a week up to day 20. Shown is the tumor growth curve of various groups of recipient mice. *p < 0.05, **p < 0.01, ***p < 0.005, and ****p < 0.0001. Also see Figure S7.