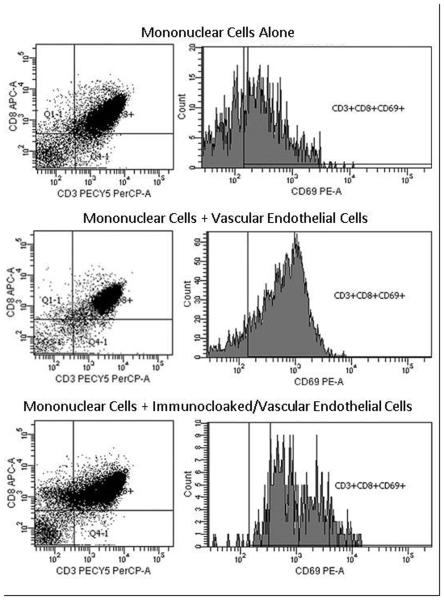
Figure 2.
Flow cytometric analysis of expression of CD3 (PerCP), CD8 (APC) and CD69 (PE) on peripheral blood MNC. Negative control was represented as MNC, allogeneic VEC were used as stimulator cells in positive control and compared to immunocloaked VEC with MNC. Tests were performed in a 96-well plate in triplicate, pooled and analyzed (N=5). Scatterplots show an inhibition of CD69 activated cytotoxic T-cells in immunocloaked wells compared to positive control.

