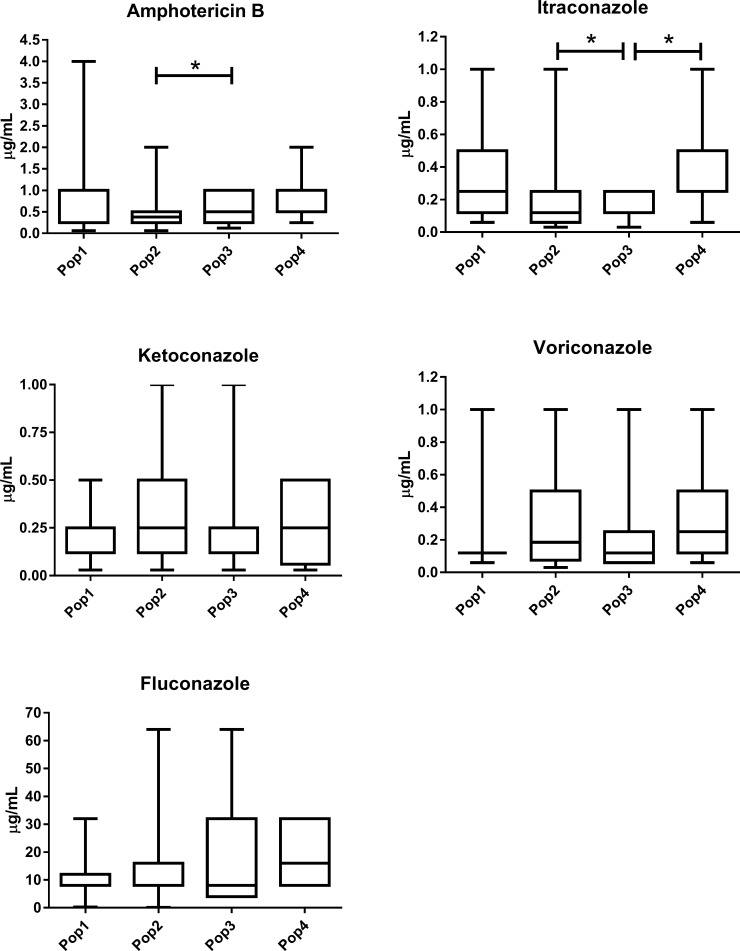
Fig 5. Comparison of the antifungal susceptibility patterns (μg/mL) among VNI populations of Cryptococcus neoformans found in this study for the antifungals tested.
Statistically significant differences (p <0.05) are marked with *, Kruskal-Wallis test followed by Dunn's test. The internal horizontal lines represent the median, the bars 25–75% percentiles and the horizontal lines percentiles 10–90%. Larger statistical data available in S3 Table.

