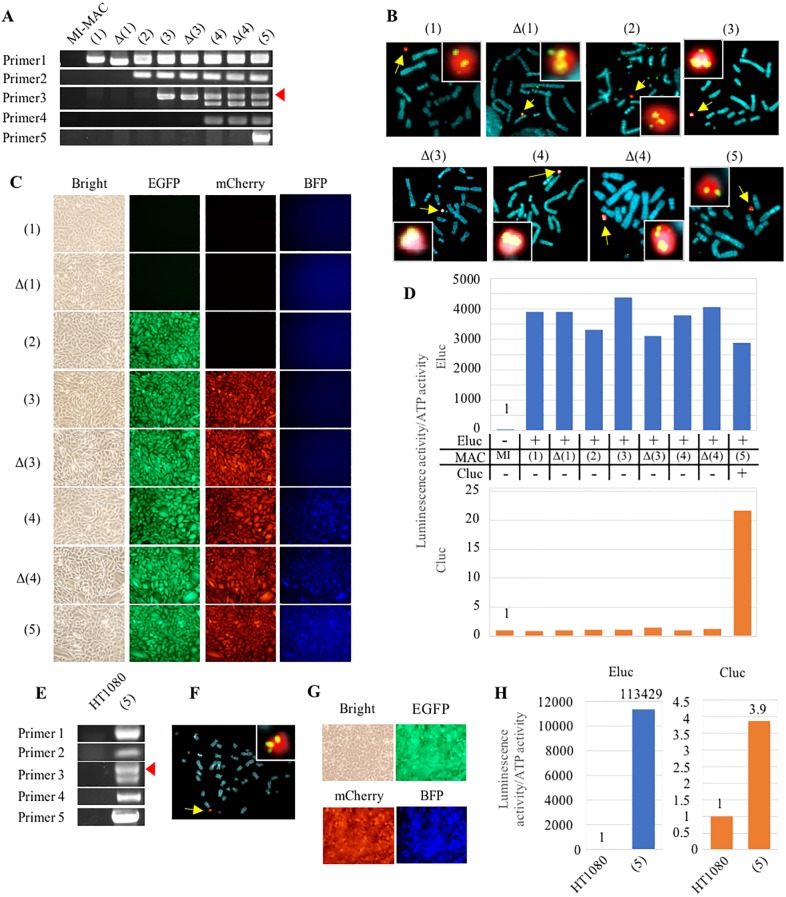
Fig 4. Multiple-GLV loading in CHO K1 cells carrying the MI-MAC and transfer of the MI-MAC with multiple GLV to HT1080 cells.
(A) Junction PCR analyses of CHO K1 cells carrying each MI-MAC. The number of the primer pair corresponds to the bidirectional arrow of Fig 3. An arrowhead shows the expected band of primer 3. (B) Two-color FISH analyses of CHO K1 cells carrying each MI-MAC using the digoxigenin-labeled mouse Cot-1 probe (red) and biotin-labeled transgene probe (green). When CHO K1 cells are transfected with gRNA/Cas9 co-expression vector, a transgene transfected just prior to this is used as a biotin-labeled probe. Arrows show MI-MACs. The inset shows enlarged images of each MI-MAC. (C) Fluorescence image analyses in CHO K1 cells carrying each MI-MAC. Bright EGFP, mCherry and BFP micrographs are shown. (D) Luminescence assay in CHO K1 cells carrying each MI-MAC. Luminescence activities were normalized by dividing luminous intensity by ATP activity. The blue and orange bars represent Eluc and Cluc luminescence, respectively. On the panel between the two bar charts, the + and − represent the presence and absence of transgene on the MI-MAC, respectively. (E) Junction PCR analyses of HT1080 cells carrying each MI-MAC. Same primer pairs are used as in Fig. 4A. The arrowhead shows the expected band of primer 3. (F) Two-color FISH analysis of HT1080 cells carrying the MI-MAC(5) using the digoxigenin-labeled mouse Cot-1 probe (red) and biotin-labeled FRThyg CAG-Cluc probe (green). An arrow shows the MI-MAC(5). The inset shows enlarged image of the MI-MAC(5). (G) Fluorescence image analyses in HT1080 cells carrying the MI-MAC(5). Bright, EGFP, mCherry, and BFP micrographs are shown. (H) Luminescence assay in HT1080 cells carrying the MI-MAC(5). Eluc and Cluc activities were normalized by dividing luminous intensity by ATP activity. The blue and orange bars represent Eluc and Cluc luminescence, respectively.

