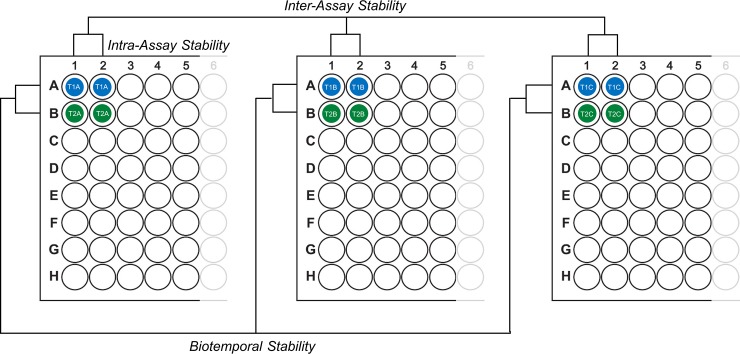
Fig 1. Structure of the assay stability evaluation scheme.
Duplicate samples were located on individual plates as shown, to allow for assessment of intra- and inter-assay precision and biotemporal stability of analyte measures. T1 and T2 denote repeat-collected CSFs from the same individual; A-C indicate different aliquots of the same CSF sample. N = 35 samples were included on each individual plate, in addition to a standard curve and spiked controls.

