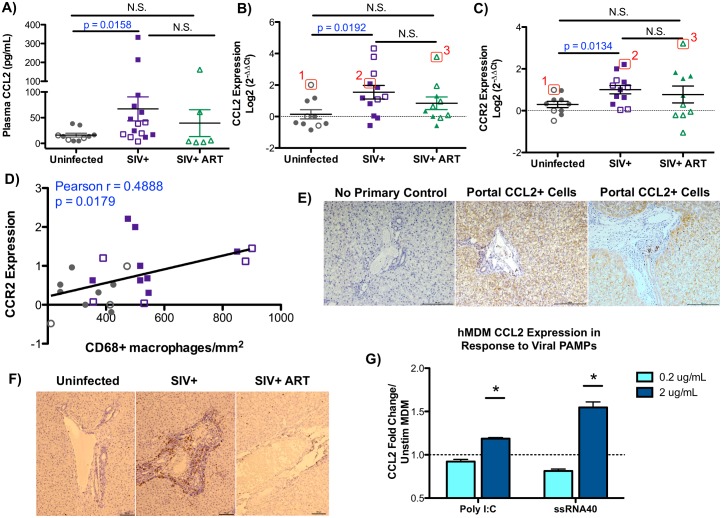
Fig 2. The CCL2-CCR2 pathway is associated with liver monocyte/macrophage infiltration.
A) Levels of CCL2 (MCP-1) in the blood were determined by Luminex analysis. Data are graphed as the mean ± SEM. Adult (open symbols) and infant (closed symbols) macaques are denoted in each graph. B-C) Hepatic expression of CCL2 (B) and its receptor, CCR2, (C) were evaluated by quantitative PCR using cDNA prepared from RNA isolated from the liver of each animal. Data are graphed as log2 transformed relative expression levels determined by the comparative threshold method. Numbered macaques (1, 2, and 3) denote CCL2 and CCR2 expression levels for these three individual macaques between panels 2B and 2C. D) Correlation between the expression of CCR2 in the liver (y-axis) and the number of liver macrophages (x-axis) in uninfected (gray points) and SIV-infected (purple points) macaques was evaluated by Pearson Correlation analysis. E) Immunostaining for CCL2 in the livers of SIV-infected macaques depicting portal regions (100X magnification, scale bar = 100 um). A no primary CCL2 antibody negative control was included to show specific staining (100X magnification, scale bar = 100 um). F) Immunohistochemical staining of recently infiltrated Mac387-positive monocyte/macrophages (brown cells) localized in the portal regions of the liver for uninfected, SIV+, and SIV+ ART macaques (100X magnification, scale bar = 100 um). G) Human monocyte-derived macrophages were stimulated with poly I:C or ssRNA40 at 0.2 and 2 ug/mL for 12 hours in duplicate. Relative expression of CCL2 was assessed by qRT-PCR comparing poly I:C and ssRNA40 stimulated cells to control (unstimulated) monocyte-derived macrophages. Data are graphed as the mean fold change in CCL2 expression ± SEM. Statistical significance was determined using a Mann Whitney T test comparing technical replicates of each condition to unstimulated cells with p ≤ 0.05 denoted as *.

