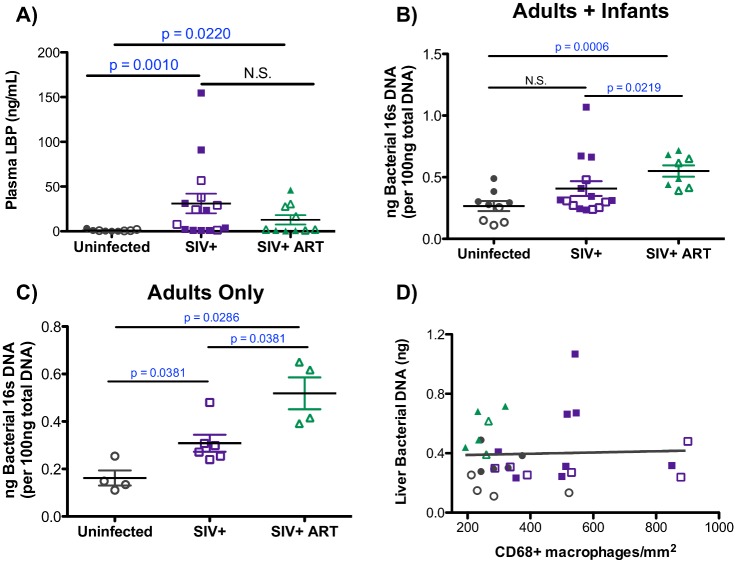
Fig 5. Levels of microbial products in the liver and in the plasma during SIV infection.
A) Plasma LBP levels were quantified in duplicate for each macaque by ELISA. Data are graphed as the mean LBP concentration (ng/mL) for each macaque ± SEM. Statistical significance was determined by Mann Whitney T tests. B-C) Levels of bacterial 16S DNA was quantified by qPCR for each liver sample assayed in duplicate. Nanograms (ng) of bacterial DNA present in 100 ng of total input DNA was determined using a standard curve and graphed as the mean of each macaque assayed in duplicate ± SEM. Infant (closed symbols) and adult macaques (open symbols) graphed together (B) or adult macaques graphed separately (C). Statistical significance was determined by Mann Whitney T tests. D) Correlation between the levels of 16S DNA in the liver (y-axis) and the number of liver macrophages (x-axis) in uninfected (gray points), SIV-infected (purple symbols), and SIV-infected cART macaques (green symbols) as evaluated by Spearman Correlation analysis.

