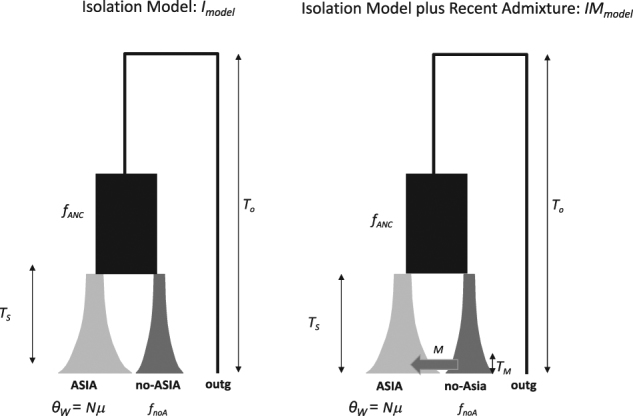
Fig. 2.

Plots of the two demographic models (I and IM) used in the ABC analysis. Extant populations (Asian and non-Asian) are represented by gray boxes, and the ancestral population is represented in black. Time is depicted on the y-axis (the present time is shown at the bottom of the figure). All parameters are reported in the Materials and Methods section
