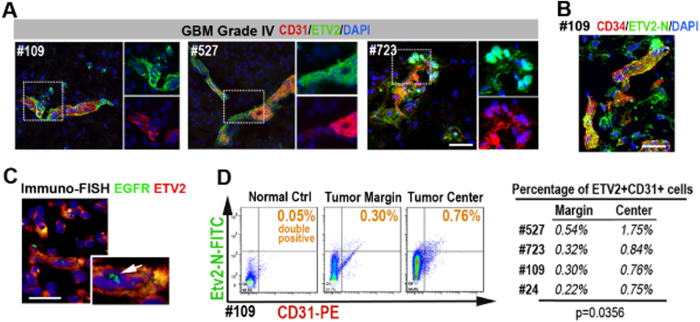
Fig. 3. ETV2+ GBM tumor cells display endothelial signatures.
a Multicolor IF staining for ETV2 and CD31 using three freshly collected grade IV GBM tissue (#109, #527, #723); areas in dotted boxes are magnified on the right. See also Fig. S4. b Multicolor IF staining for ETV2 and CD34 using GBM #109; the area in the dotted box is magnified on the right. c Immuno-FISH staining indicated that the ETV2+ cells were actually malignant. Scale bars in a, b, c: 50 μm. d One representative patient sample for comparison of the percentage of CD31+ ETV2+ cells in the margin areas and deeper areas (3–5 cm from the margin) of the resected GBM tissues; the percentage of ETV2+ CD31+ cells among CD31+ cells is marked c and summarized in a table (c, right panel)

