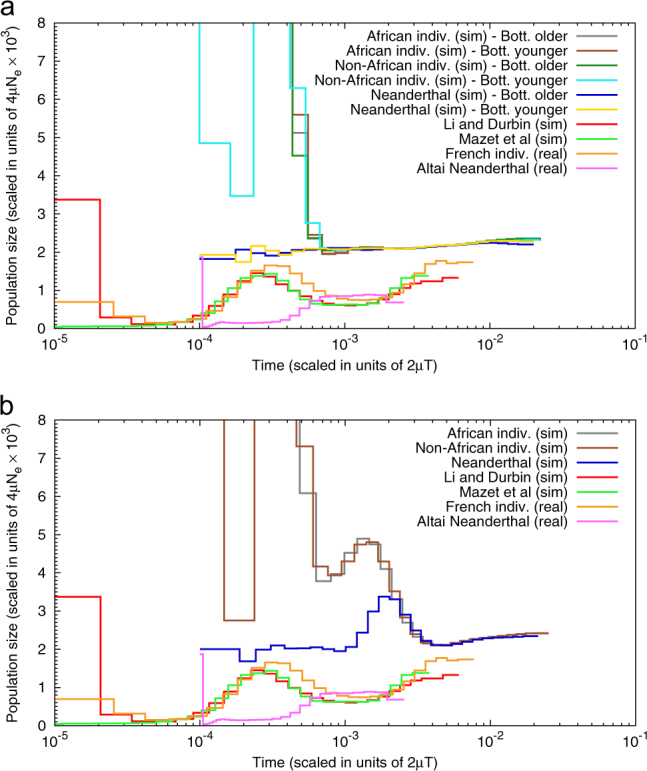
Fig. 4.

PSMC plots for the admixture and ancient structure models of Yang et al. (2012). This figure shows the PSMC plots for genomic data simulated under the models of admixture (panel a) and ancient population structure (panel b). The models of Yang et al. (2012) have three populations corresponding to Africans, non-Africans (Europeans or Asians) and Neanderthals. We obtained the PSMC plots for one individual from each of these populations, with parameter values used by the authors. Additional figures can be found in the Supplementary Materials. Here, we represent individuals simulated under the three main models, namely recent admixture with a bottleneck that is either (i) younger, or (ii) older than the admixure event and, (iii) ancient structure. In panel a the African, Non-African and Neanderthal individuals were simulated under the model of recent admixture with a bottleneck that was either older or younger than the admixture event. In panel b the PSMCs were obtained for an African, Non-African and Neanderthal individual simulated under the model of ancient structure. For the simulated Neanderthals the PSMC curves stop in the past at a time corresponding to the age of the real Neanderthal sample (pink line). The PSMC results obtained for the real genomic data of a French (human, isolated orange line) and a Neanderthal (unknown nationality, pink line) are represented for comparison. The red and light green lines that are on top of each other represent the PSMC plots based on the ms commands of Li and Durbin (2011) and Mazet et al. (2016), respectively
