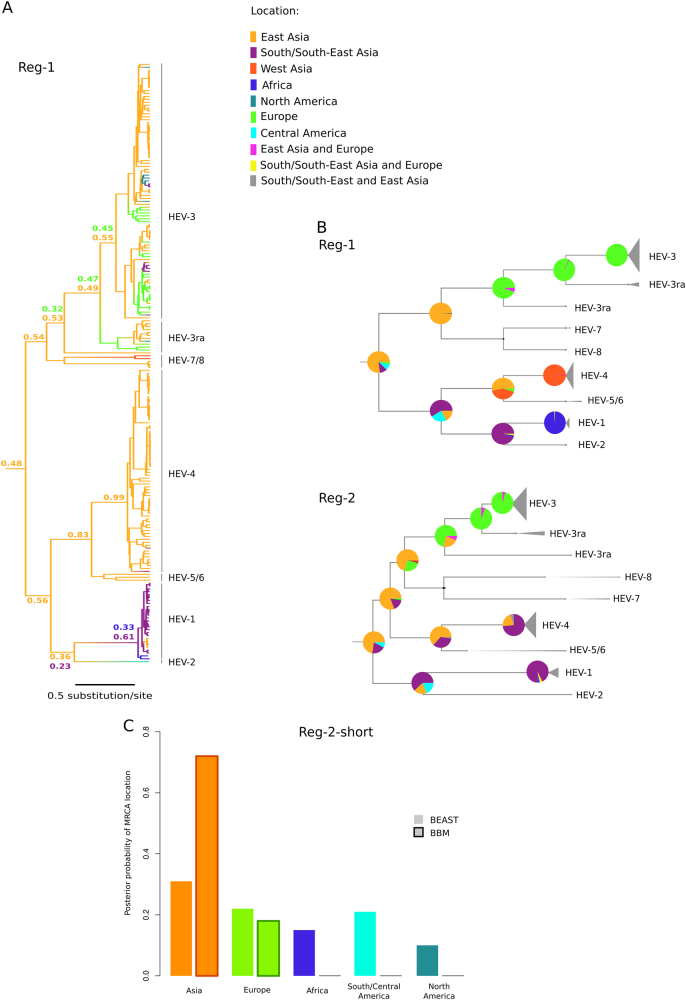
Fig. 2. Phylogeographic analysis of Orthohepevirus A.
a Maximum clade credibility tree for Reg-1. Branches are colored according to inferred ancestral location; posterior support for inferred locations at relevant nodes is shown. b The topologies of the Reg-1 and Reg-2 trees are shown. Pie charts represent the ancestral location probability of the respective area. Probabilities were averaged over 100 BBM runs with a similar number of sequences from East Asia, South/South-East Asia, and Europe. In BBM analyses, combined regions appear because we allowed two areas per node. c Posterior probability distributions for the location of the Orthohepevirus A MRCA obtained using BEAST and BBM. Results refer to the Reg-2-short region

