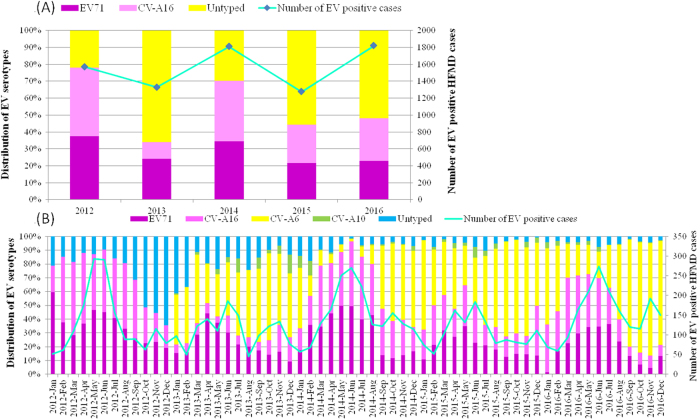
Fig. 2. Enterovirus-associated HFMD cases and enterovirus distribution in Shanghai, China from 2012 to 2016.
a Continuous lines represent the number of EV-positive HFMD cases; the histogram shows the percentages of EV71, CV-A16 and untyped enterovirus isolated from EV-positive samples. b Monthly distribution of enterovirus serotypes from HFMD cases in Shanghai from 2012 to 2016. *In a, all the untyped EV refers to pan EV-positive but EV71- and CV-A16-negative samples. In b, the untyped EV samples in 2012 correspond to pan EV-positive but EV71- and CV-A16-negative samples, and untyped EV samples from 2013 to 2016 correspond to pan EV-positive but EV71, CV-A16, CV-A6 and CV-A10-negative samples

