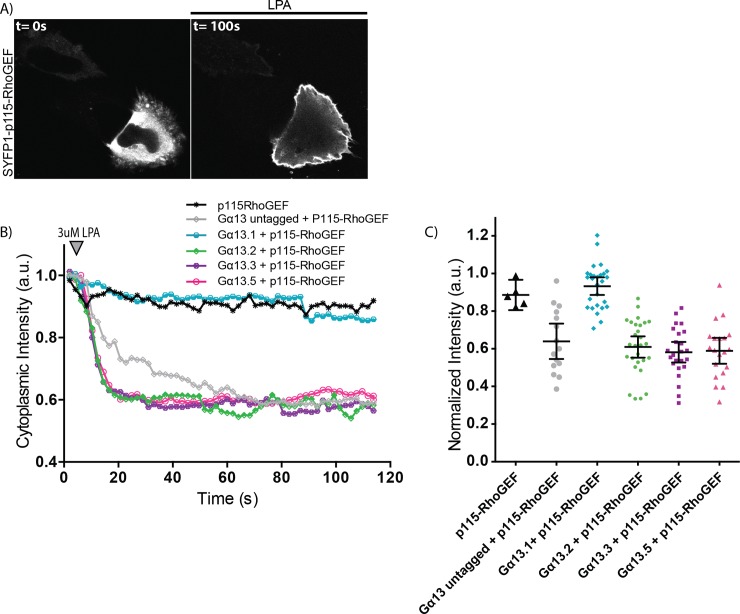
Fig 2. Capacity of the tagged Gα13 variants to recruit p115-RhoGEF.
(A) Confocal images of a representative HeLa cell expressing SYFP1-p115-RhoGEF, Gα13.2-mTurquoise2-Δ9 and LPA2-P2A-mCherry (here only SYFP1-p115-RhoGEF is shown, for the localization of the other constructs see S2 Fig) (before (t = 0s) and after (t = 100s) addition of 3μM LPA). The width of the pictures is 67μm. (B) The mean cytoplasmic fluorescence intensity of SYFP1-p115-RhoGEF over time. After 8s, 3μM LPA was added. All cells transiently expressed LPA2 receptor-P2A-mCherry. The number of cells imaged is p115-RhoGEF n = 5, Gα13 untagged + p115-RhoGEF n = 15, Gα13.1 + p115-RhoGEF n = 27, Gα13.2 + p115-RhoGEF n = 28, Gα13.3 + p115-RhoGEF n = 24, Gα13.5 + p115-RhoGEF n = 20. Data have been derived from three independent experiments. (C) Quantification of the fluorescence intensity at t = 50s for each Gα13 variant, relative to t = 0s. The dots indicate individual cells and the error bars show 95% confidence intervals. The numbers of cells analyzed is the same as in (B).

