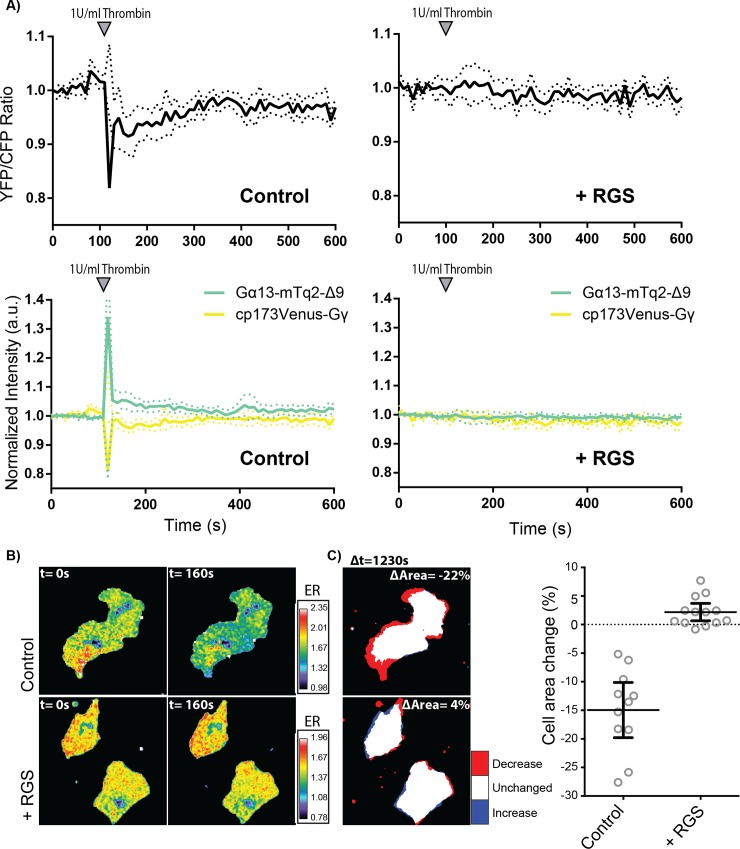
Fig 5. Effects of the p115-RhoGEF RGS domain on Gα13.2 activity and cell morphology.
(A) Normalized ratiometric traces (upper graphs) and corresponding YFP and CFP traces (lower graphs) (dotted lines depict 95% CI) of HUVECs that were transfected with either the Gα13.2 FRET sensor and Lck-mCherry (Control, n = 11) or the Gα13.2 FRET sensor and Lck-mCherry-RGS (+ RGS, n = 13). Cells were stimulated at t = 110s. (B) Ratiometric images of representative cells measured in (A). Cool colors represent low YFP/CFP ratios, corresponding to emission ratios (ERs) on the right.(C) Cell area change of the cells measured in (B), visualized according to the LUT panel on the right. Dotplots on the right represent individual measurements (± 95% CI) of corresponding cells measured in (A). Image width = 54μm.

