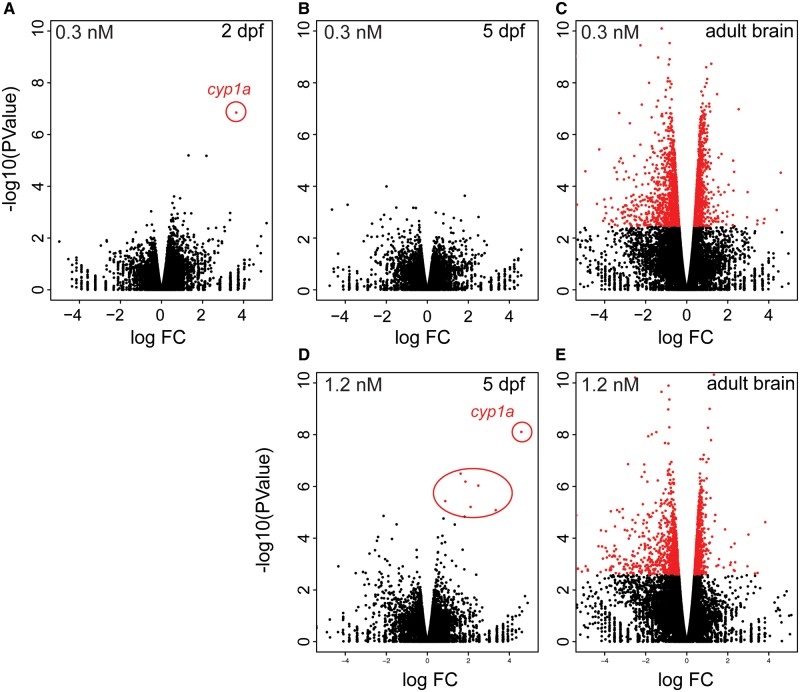
Figure 1.
Transcriptional changes associated with developmental exposure to PCB126. Volcano plots showing gene expression changes in zebrafish exposed to 0.3 nM (top panel) and 1.2 nM PCB126 (bottom panel). A, 2 dpf embryos; B and D, 5 dpf larvae; C and E, Adult brains (6 months). Each spot in the graphs represents 1 gene. Red spots represent significant DEGs (FDR ≤ 5%). The few significant DEGs are highlighted in (A) and (D).

