Figure 2.

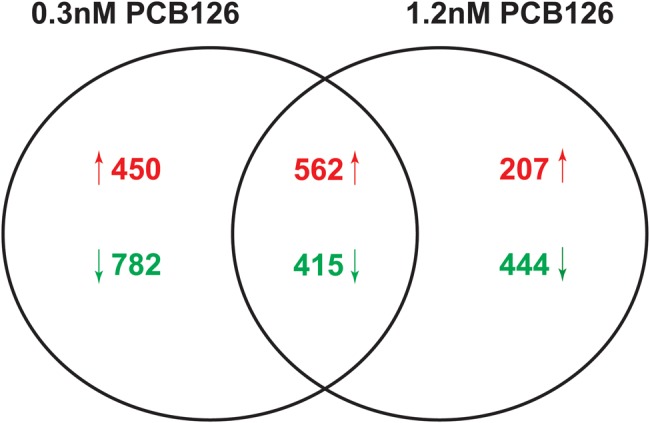
Number of DEGs in adult zebrafish brain. Venn diagram shows the number of unique and common DEGs in the adults that were developmentally exposed to 0.3 or 1.2 nM PCB126. Arrows represent up- and down-regulated genes.

Number of DEGs in adult zebrafish brain. Venn diagram shows the number of unique and common DEGs in the adults that were developmentally exposed to 0.3 or 1.2 nM PCB126. Arrows represent up- and down-regulated genes.