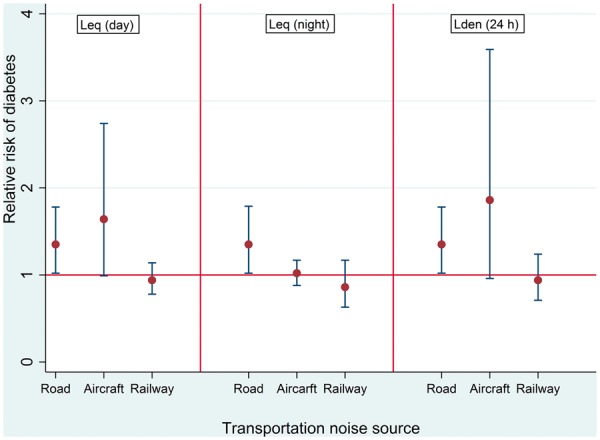
Figure 1.

Relationship between transportation noise and risk of diabetes. All effect estimates are per inter-quartile range of respective noise metric (Lden/Lday/Lnight road: 10dB; Lden/Lday aircraft: 12dB; Lden/Lday/Lnight railway: 11dB). Leq: noise level. Lden: day-evening-night noise level. All estimates are from multi-exposure models adjusted for age, sex, educational level, neighborhood socio-economic index, smoking status and pack years, consumption of alcohol, fruits and vegetables, nitrogen dioxide, physical activity, body mass index and change in body mass index. Random intercepts were applied at the level of the study areas in the all models.
