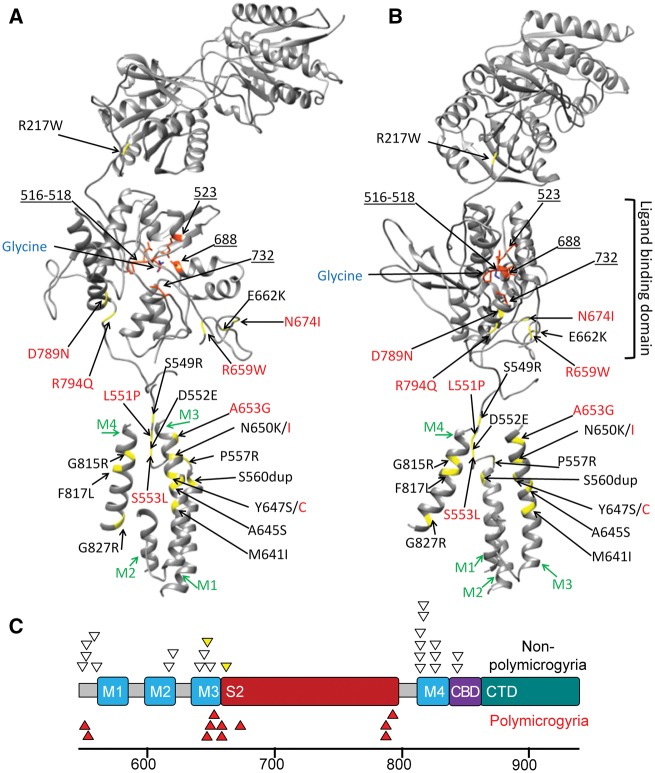
Figure 2.
Position of the GRIN1 mutations. (A) This ribbon diagram of the GluN1 subunit of the NMDA receptor demonstrates the location of the binding site of glycine in the ligand binding domain, transmembrane helices (M1-M4 in green) and glycine binding residues of GluN1 (orange residues and blue underlined numbers). Mutated residues are in yellow. Polymicrogyria-associated mutations are in red text and previous GRIN1 mutations are in black text. (B) The same ribbon model rotated 90 degrees in the axial plane. (C) A model of the C-terminal end of GRIN1. In addition to showing M1-M4, the model shows the position of the second ligand binding domain (S2), calmodulin biding domain (CBD) and the C-terminal domain (CTD). Codon position is listed below the model. Heterozygous GRIN1 variants reported or reviewed by Lemke et al. (2016) (non-polymicrogyria, white triangles) are shown above the model. The two yellow triangles represent subjects with CT brain imaging only. Polymicrogyria-associated GRIN1 mutations (red triangles) cluster in the S2 domain (6/11) or in the adjacent Lurcher motif of M3 (3/11).

