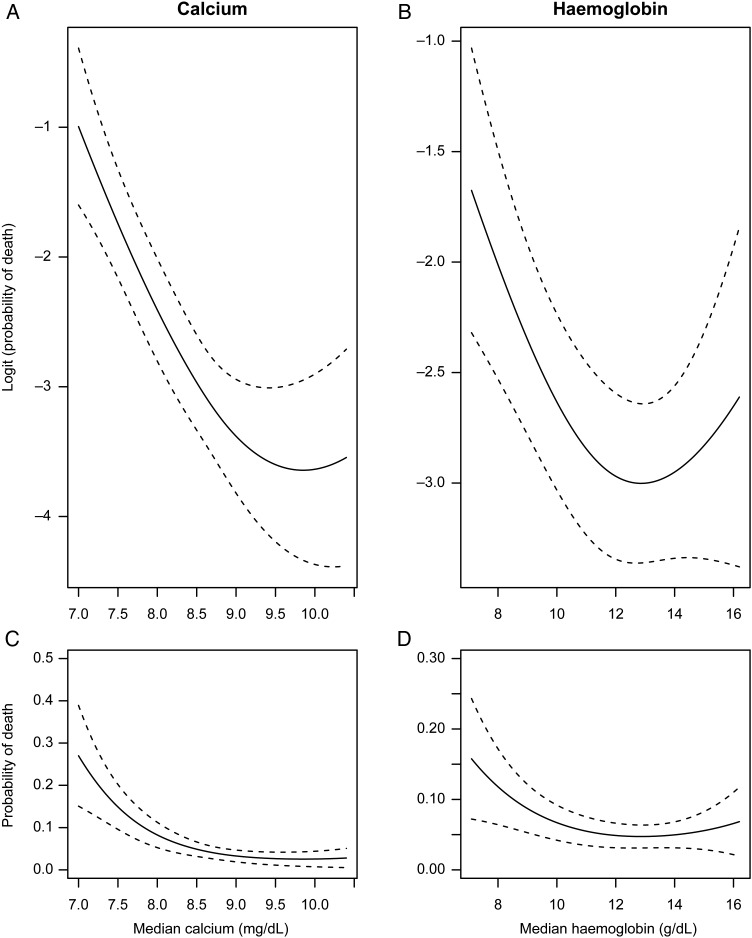
Figure 2.
Observed non-linearities in the predicted probabilities of death for calcium (A) and haemoglobin (B) on the logistic (i.e. linear) and probability (C/D) scales. Both show a sharp decreasing relationship with death at lower values, which levels off at more moderate values. Models were estimated using cubic splines and were adjusted for age, sex, and race. 95% confidence bands are shown.

