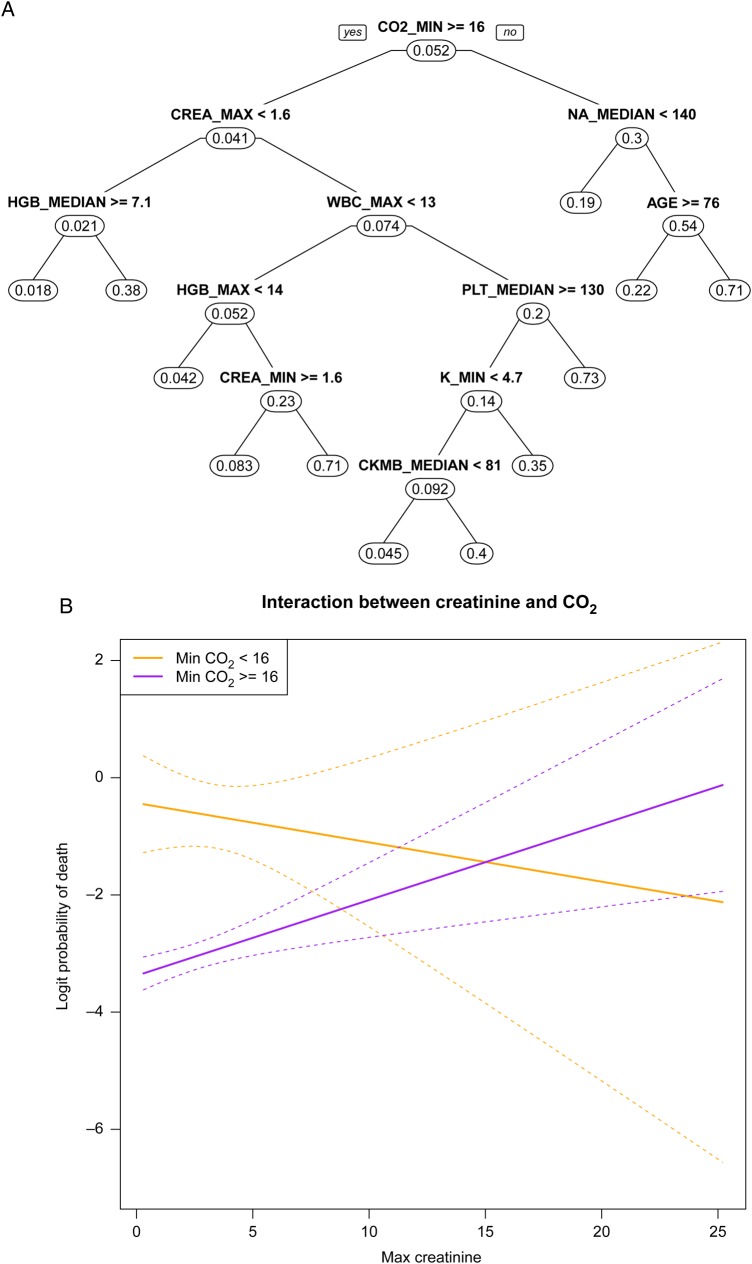
Figure 3.
Classification and regression trees (A) for predicting acute myocardial infarction. The first split is on minimum CO2. Splits on different sides of the tree (creatinine on left, sodium on right) indicate potential interactions. Interaction plot (B) between CO2 and creatinine highlights the differential relationship.

