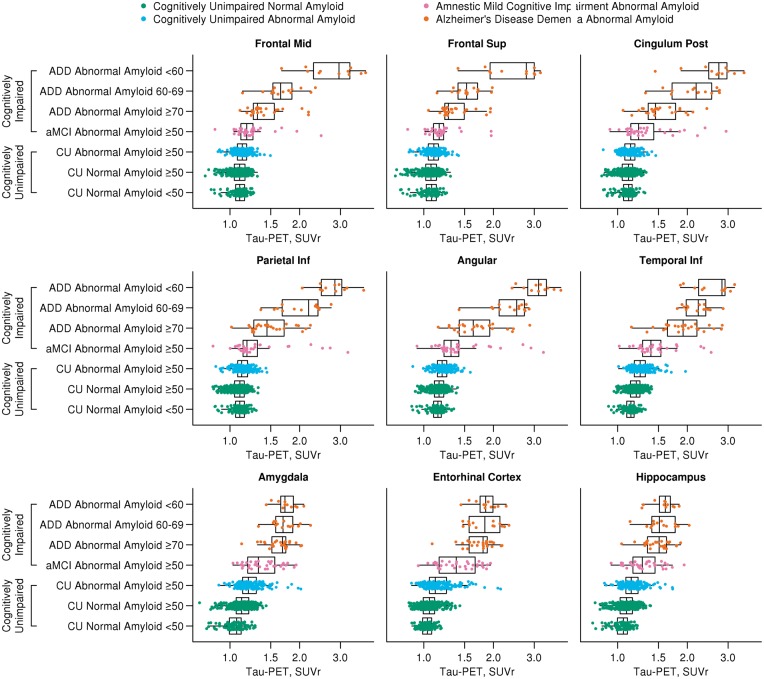
Figure 4.
Box plots of regional tau-PET SUVr by age, amyloid-PET status and diagnosis subcategorization. Box plots of tau-PET SUVr for nine regions of interest by clinical diagnosis, amyloid-PET status, and age. Clinical diagnosis and amyloid-PET status are represented with different colours: normal amyloid cognitively unimpaired, green; abnormal amyloid cognitively unimpaired, blue; abnormal amyloid amnestic MCI (aMCI), purple; abnormal amyloid ADD, orange. Tau-PET SUVr differed significantly (P < 0.01), after adjusting for multiple comparisons, among the three cognitively unimpaired groups and among the four cognitively impaired groups for all nine regions shown in the figure. There is greater tau signal in the medial and extra medial temporal regions (inferior temporal for example; other regions seen on Supplementary Fig. 7) than in the cognitively unimpaired >50 normal amyloid group versus the cognitively unimpaired normal amyloid <50 group. The box plots also show a similar pattern of increased tau-PET signal in younger age ADD as compared to the cluster analysis with much higher extra-temporal tau-PET signal. However, there are participants in the younger age ADD group with tau-PET signal similar to the older age ADD group.

