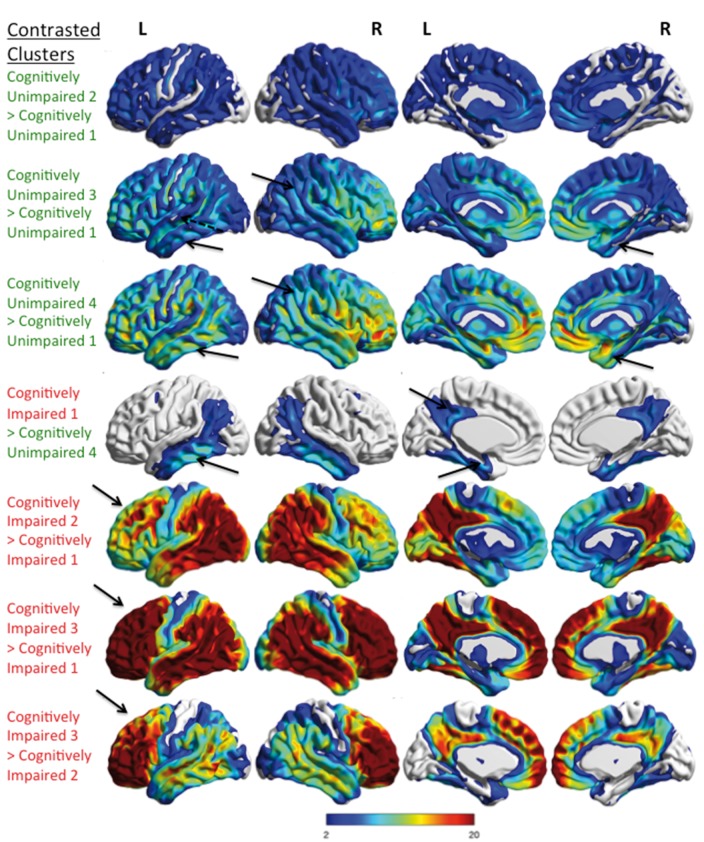
Figure 5.
Comparison of the differences in tau-PET signal between hierarchical clusters. Voxel-wise tau-PET findings that are greater between pairs of hierarchical clusters are shown. The upper three rows show the comparisons of cognitively unimpaired clusters (green text). The lower four rows show cognitively impaired cluster comparisons (red text). There is greater tau-PET signal diffusely in cognitively unimpaired 2 versus cognitively unimpaired 1 clusters. Greater tau-PET signal is seen in cognitively unimpaired 3 and cognitively unimpaired 4 versus cognitively unimpaired 1 in the whole temporal and parietal lobes (arrows). Frontal accumulation is incrementally greater also. The incremental tau-PET signal seen between the different cognitively unimpaired clusters involves many regions of the brain outside of the temporal lobe. The magnitude of the increased tau-PET signal in the cognitively impaired clusters is greatest in the frontal lobes and is similar to the findings in Fig. 3. The cognitively impaired cluster 1 shows increased inferior temporal, medial temporal and posterior cingulate tau-PET signal (arrows) as compared to cognitively unimpaired cluster 4. Greater tau-PET signal in cognitively impaired 2 versus cognitively impaired 1 is seen in the temporal, parietal and posterior cingulate regions and less so in the frontal lobe (arrow). Cognitively impaired cluster 3 showed greater tau-PET signal in the frontal, temporal, parietal, posterior cingulate and angular regions than cognitively impaired 1 or cognitively impaired 2 clusters with pronounced increase in the frontal lobe versus cognitively impaired cluster 1 (arrows). All results were family-wise error (FWE) corrected, P < 0.05 and the colour bar shows the T-statistic range for all contrasts but is descriptive as the clustering was defined by using tau-PET SUVr.

