Figure 1.

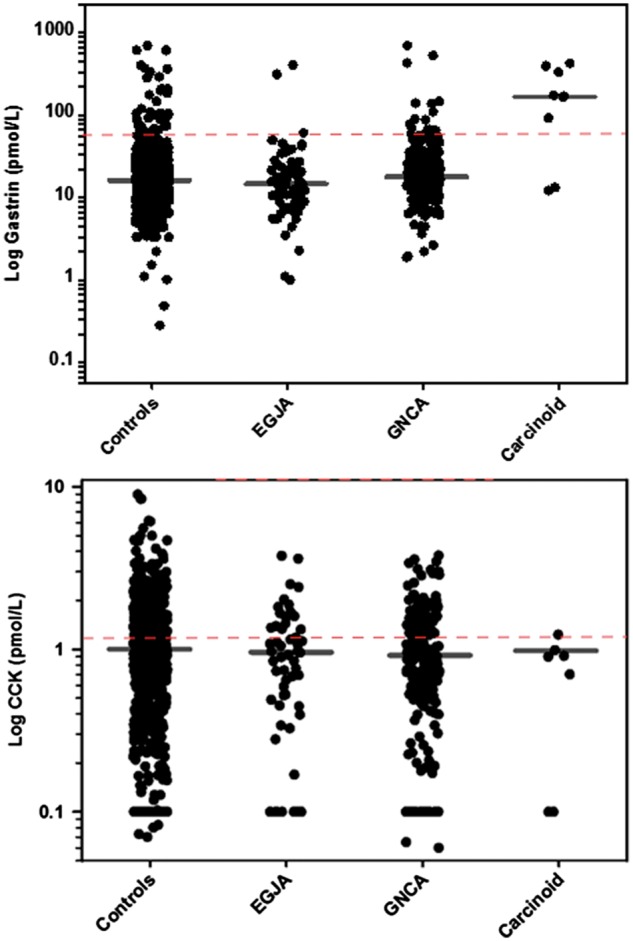
Scatterplots showing the distribution of serum gastrin and CCK concentrations by case type. Horizontal lines denote the median concentration in each group.

Scatterplots showing the distribution of serum gastrin and CCK concentrations by case type. Horizontal lines denote the median concentration in each group.