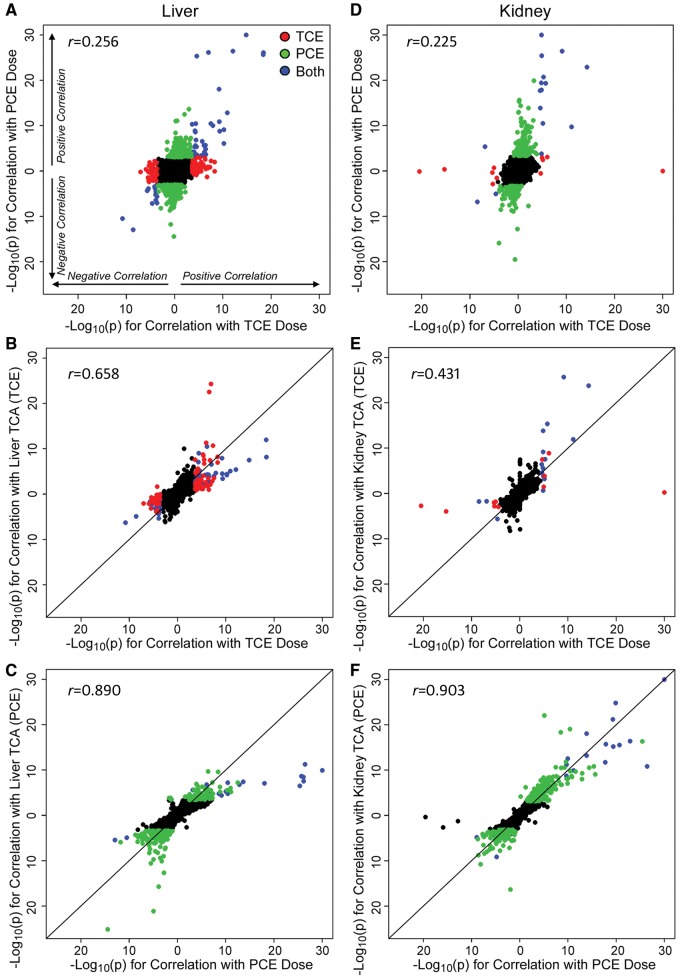
Figure 3.
Correlation analysis of dose-response in gene expression in mouse liver (A–C) and kidney (D–F) following treatment with TCE or PCE. Plotted are −Log10(P values) for dose-responsive differential gene expression analysis, right and top of axes origin are genes with positive association, left and bottom of axes origin are genes with negative association. Dots are individual genes and the color scheme is as follows: red (genes that are significant with false discovery rate (FDR) q < 0.05 in TCE but not PCE), green (q < 0.05 in PCE but not TCE), blue (significant with q < 0.05 for both TCE and PCE), and black (not significant for both TCE and PCE). A, Genes significantly correlated with the administered dose of either PCE or TCE. B, Genes significantly correlated with both TCE dose and liver TCA levels. C, Genes significantly correlated with both PCE dose and liver TCA levels. Panels D–F are same as A–C but for kidney. Pearson (r) correlation coefficients are shown for each plot.

