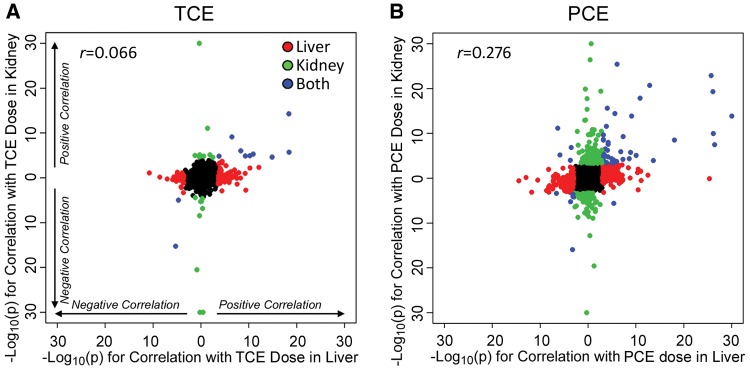
Figure 4.
Correlation analysis of gene expression responses between mouse liver and kidney following treatment with TCE (A) or PCE (B). Plotted are −log10(P values) for dose-responsive differential gene expression analysis (compared with TCE or PCE dose). Colors and directionality in effects are same as in the legend to Figure 3. Pearson (r) correlation coefficients are shown for each correlation.

