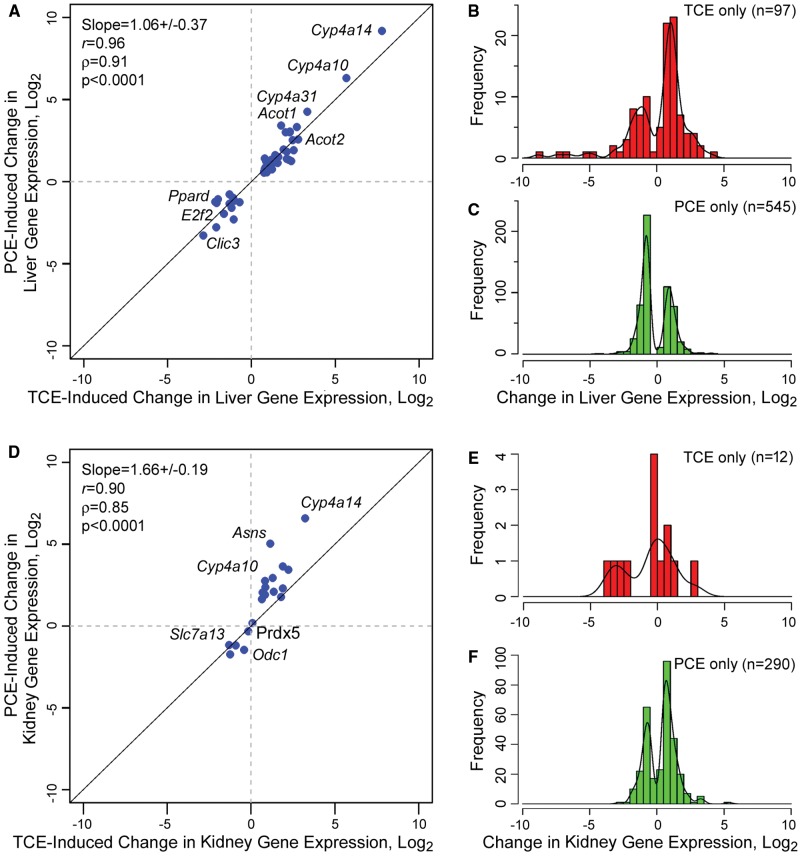
Figure 5.
Analysis of the transcriptional effects of TCE (800 mg/kg or 6 mmol/kg) and PCE (1000 mg/kg or 6 mmol/kg) in mouse liver (A–C) and kidney (D–F). Shown are genes that were significantly (FDR q < 0.05) up- or downregulated by treatment with either chemical. A and D, Genes that were significant for both TCE and PCE in liver (n = 54, only genes with official gene symbols counted) or kidney (n = 16, only genes with official gene symbols counted). Maximum fold-change in gene expression, converted to log2 values, is plotted for each gene. Regression analysis slope, correlation coefficients and significance are shown. Select genes are highlighted. B and C, Histograms of log2 maximum fold-change values for genes that are significant in liver either for TCE (n = 97) or PCE (n = 545). E and F, Histograms of log2 maximum fold-change values for genes that are significant in kidney either for TCE (n = 12) or PCE (n = 290). Lists of genes shown in each panel are provided as Supplementary Table 12.

