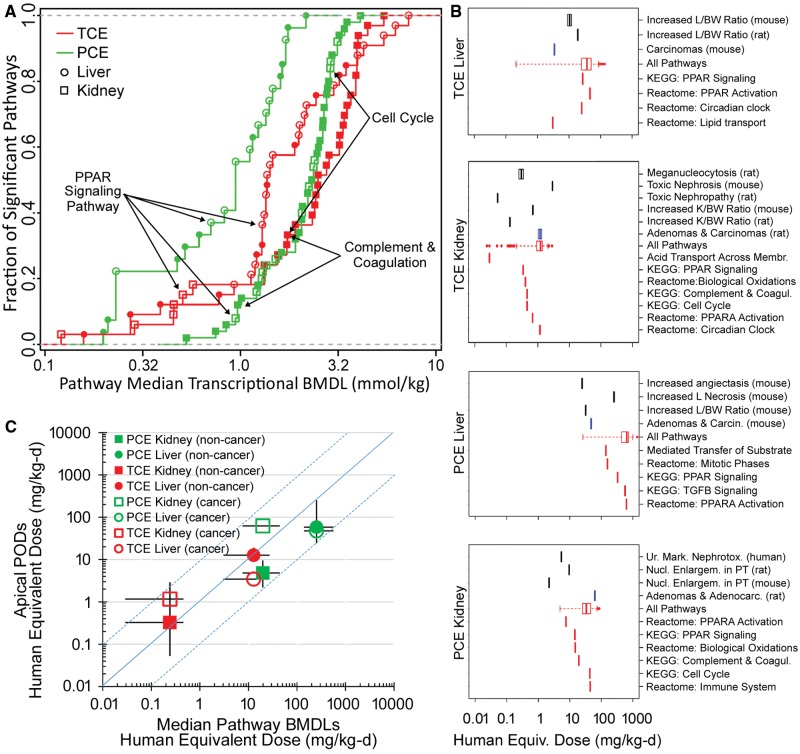
Figure 7.
Dose-response analysis of the transcriptional and apical effects of TCE and PCE in mouse liver and kidney. A, Point of departure (POD) (median BMDL) for pathways (Kyoto Encyclopedia of Genes and Genomes [KEGG] or Reactome) that were significantly perturbed (Fisher’s exact 2-tailed P < 0.05) by treatment with TCE (red) or PCE (green) in mouse liver (circles) and kidney (squares). Open symbols are KEGG pathways and closed symbols are Reactome pathways. A complete list of pathways and associated dose-response PODs are included as Supplementary Table 19. Select common pathways are labeled. B, Comparison of the apical POD (noncancer endpoints are black vertical bars, cancer endpoints are blue vertical bars) and transcriptomic POD ranges for all pathways (red box and whisker plots showing distribution of median pathway BMDLs) and selected pathways (individual red vertical lines showing individual median pathway BMDLs) after treatment with TCE or PCE. Complete details of the apical endpoint types, studies from which they were derived, and PODs for the pathways are available in Supplementary Tables 19 and 20. To enable direct comparison of the apical and transcriptional PODs to human exposure, all doses were converted to human equivalent doses using the following metrics: liver oxidative metabolism (for TCE and PCE Liver), GSH conjugation metabolism (for TCE Kidney), and PCE area under the curve (for PCE Kidney). C, Relationship between transcriptional and apical PODs converted to human equivalent doses. Symbols and error bars are the geometric means and ranges, respectively, of the median transcriptional BMDLs plotted against the corresponding geometric means and range of the apical PODs, from each panel in (B). Symbol shapes and colors represent different treatment (PCE or TCE), target tissue (kidney or liver), and type of apical POD (noncancer or cancer) as shown in the legend of panel C. Blue dotted lines are ± 1 order of magnitude deviation from perfect correspondence.

