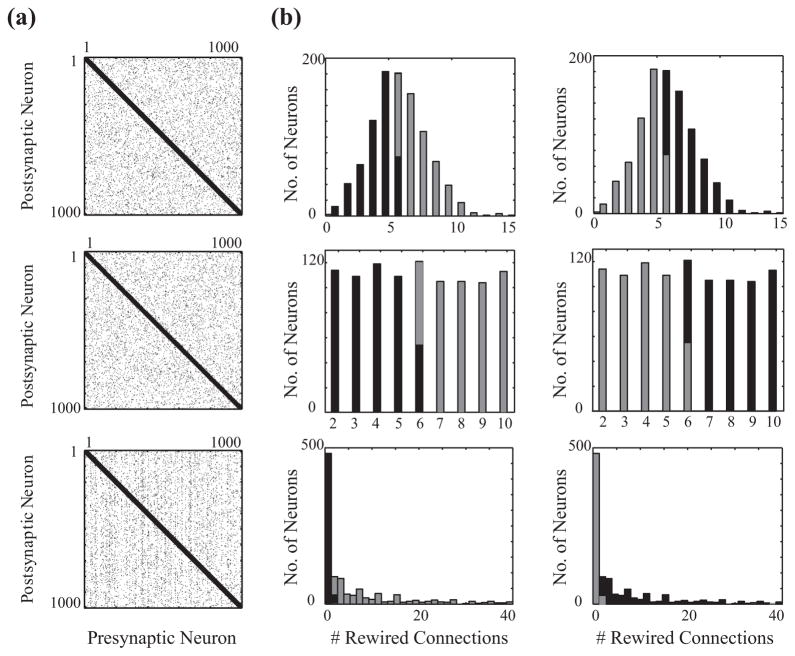
FIG. 1.
(a) Examples of connectivity matrices for three different distributions of rewiring probability of individual cells. (b) Histograms of the number of neurons with a specific number of rewired connections for the standard Poisson (top row), uniform (middle row), and exponential (bottom row) rewiring distributions for type I (left column) and type II highly rewired scenarios (right column) for a mixed network of 50% type I and 50% type II cells. In the type I highly rewired scenario (left column), neurons with the higher number of rewired outgoing connections have type I excitability characteristics (light gray bars), while in the type II highly rewired scenario (right column) type II neurons have a higher number of rewired outgoing connections (black bars).

