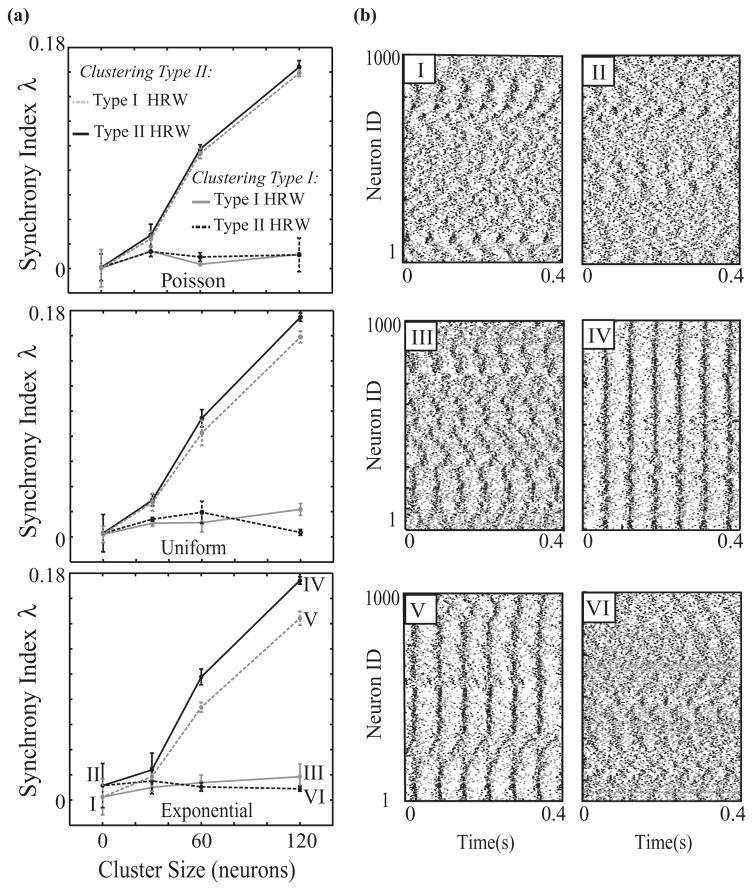
FIG. 8.
Synchrony in networks with high connectivity clusters. (a) Synchronization of mixed networks of 50% type I and 50% type II cells with P = 0.15 and W = 0.005mS/cm2. Here we interconnected a fraction of the most highly rewired or least rewired neurons to form connected clusters in the Poisson (top panel), uniform (middle panel), and exponential (bottom panel) distributions for the type I HRW and type II HRW cases. (b) Example raster plots for exponential distribution networks in the type I HRW (left column) and type II HRW (right column) scenarios before the cluster is formed (top row), with a cluster consisting of the top 12% of highly rewired neurons (middle row), and with a cluster consisting of the lowest 12% of rewired neurons (bottom row) (panel numbers I–VI correspond to labeled points on curves in bottom panel of (a).

