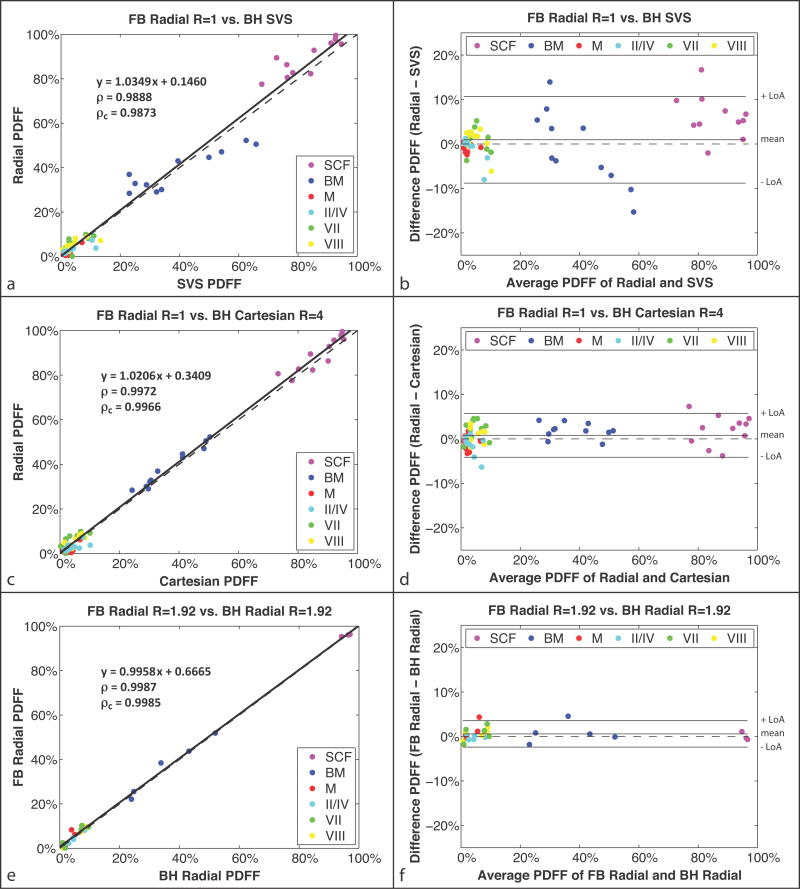
Figure 8.
In vivo liver study (a,c,e) linear correlation plots and (b,d,f) Bland-Altman plots for PDFF of regions of interest in the SCF; BM; M; and Couinaud-Bismuth segments II/IV, VII, and VIII. The comparison of (a–b) radial R = 1 versus SVS had MD = 0.95% and LoA = MD ± 9.74%; (c–d) radial R = 1 versus Cartesian R = 4 had MD = 0.82% and LoA = MD ± 4.9%; and (e–f) FB radial R = 1.92 versus BH radial R = 1.92 had MD = 0.58% and LoA = MD ± 2.97%. The correlation coefficients ρ and ρc were significant in all cases with P ≪ 0.01. The dashed lines represent y = x in the linear correlation plots and y = 0 in the Bland-Altman plots. BH, breath-hold; BM, bone marrow; FB, free-breathing; LoA, limits of agreement; M, muscle; MD, mean difference; PDFF, proton-density fat fraction; SCF, subcutaneous fat; SVS, single-voxel MR spectroscopy.

