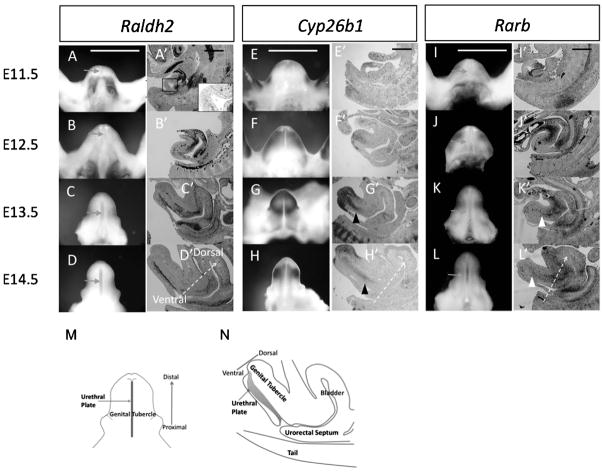
Fig. 1.
RA signaling activities are detected during GT development. A–L are ventral views of GT; A′–L′ are midline sagittal sections of the caudal urogenital region. A–D and A′–D′: Raldh2 is expressed in the caudal ventral region adjacent to the GT at E10.5, but not in the urethral plate epithelium (UE, enlarged view in A′) (A and A′); its expression begins in the UE from E12.5 (B and B′), becoming stronger in the UE at E13.5 and E14.5 (C, C′, D and D′). Arrows in A–D indicate the UE. The areas in between the dashed lines in A′–D′ indicate the UE. E–H and E′–H′: Cyp26b1 is expressed in the mesenchyme adjacent to the distal ectodermal epithelium of the GT at E11.5 (E and E′), becomes broadly expressed in the mesenchyme at E12.5 (F and F′); and its expression becomes restricted to the mesenchyme dorsal of the UE in the proximal region and in the distal mesenchyme of the GT at E13.5 and E14.5 (G, G′, H, and H′). Black arrowheads indicate Cyp26b1 expression in the proximal GT. I–L and I′–L′: Rarb is expressed in the caudal region adjacent to the proximal GT at E11.5 and E12.5 (I, I′, J, and J′). Its expression begins in the UE and mesenchyme of the prospective corpus cavernosum penis in the proximal GT areas at E13.5 to E14.5 (K, K′, L, and L′). White arrowheads indicate Rarb expression in the prospective corpus cavernosum penis of the GT. Scale bar, 400 μm. Arrows with dashed stems in D′, H′, and L′ indicate the ventral–dorsal direction of the GT. M: schematic picture for ventral view of E14.5 GT. N: schematic picture for midline sagittal view of E14.5 GT. GT, genital tubercle; RA, retinoic acid.

