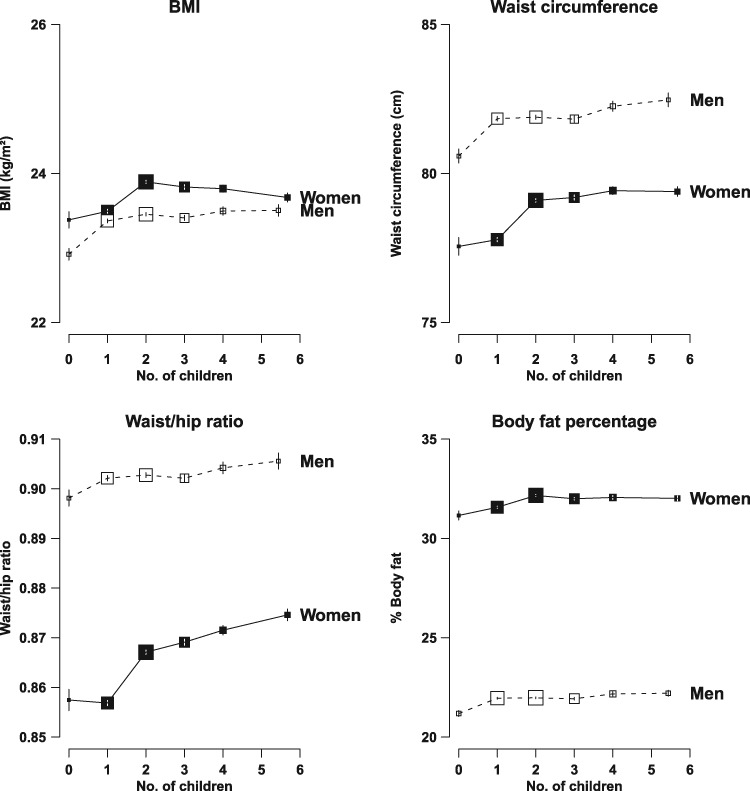
Figure 2.
Body mass index (BMI) and waist circumference (WC) vs number of live births in women and number of children fathered in men. The means of each anthropometric measure was adjusted for age, region, education, household income, smoking, alcohol and physical activity. Closed squares and solid lines represent the means of anthropometric measures for women whereas open squares and dash lines represent the means for men. Other conventions as in Figure 1.

