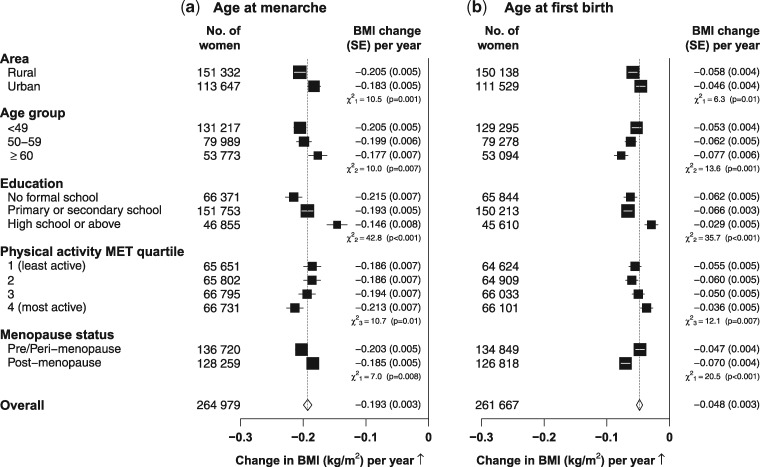
Figure 4.
Change in BMI associated with 1-year increase of (a) age at menarche among all women and (b) age at first birth among parous women only in certain population subgroups. The analysis was adjusted for age, area and other lifestyle factors (where appropriate). Each closed square represents a change in BMI per year increasing. The dotted vertical line indicates the overall change in BMI; the open diamond indicates it and its 95% confidence interval.

