Figure 1.
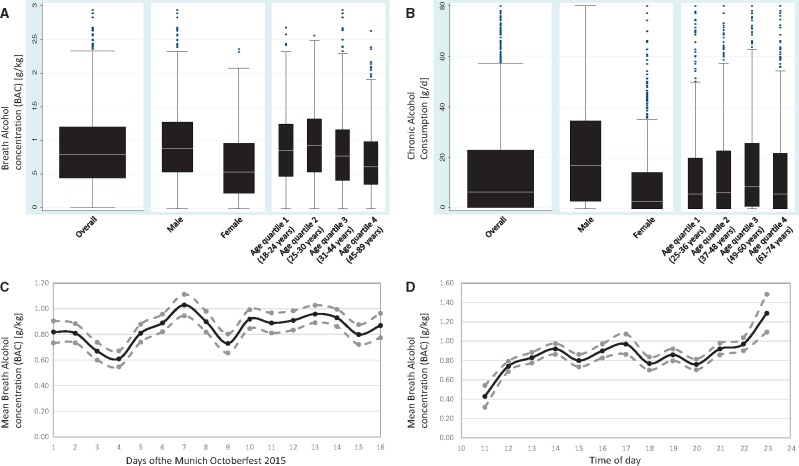
Alcohol consumption. A. Distribution of breath alcohol concentration (BAC) across the acute alcohol cohort in g/kg. Results presented for the entire cohort, and stratified by sex and quartiles of age. B. Distribution of chronic alcohol consumption in KORA S4 in g/d. Results presented for the entire cohort, and stratified by sex and quartiles of age. Outliers truncated at 80 g/d. C. Day-by-day variability of mean BAC for each of the 16 days of the Octoberfest. D. Circadian variability of mean BAC across recruitment days at the Octoberfest.

