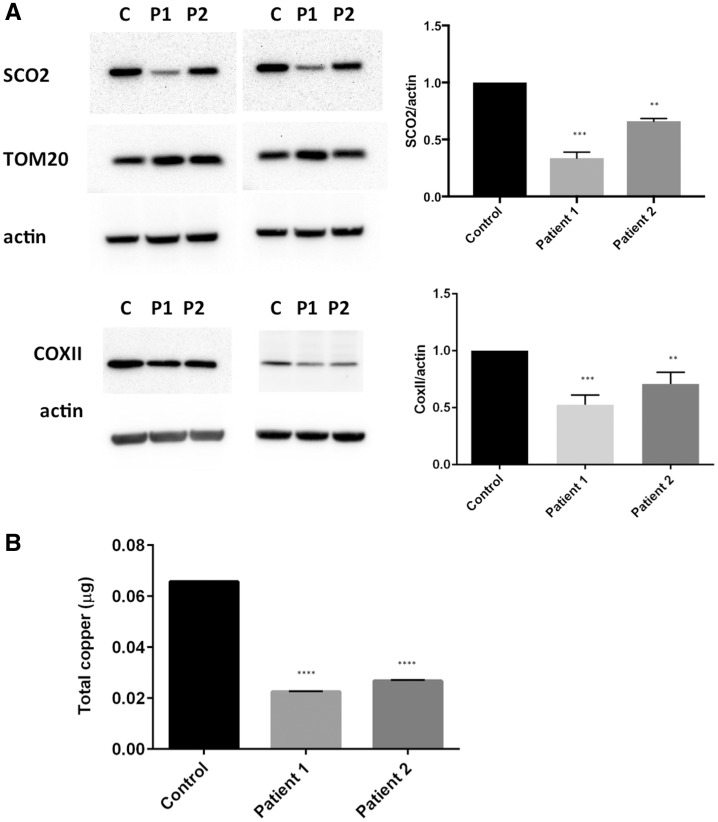
Figure 3.
Fibroblasts from patients show decreased levels of SCO2, COXII and copper levels. (A) Western blot shows decreased levels of SCO2 and COXII in Patients 1 and 2. One-way ANOVA with Tukey’s multiple comparisons test: control versus Patient 1 (P < 0.001), control versus Patient 2 (P < 0.01). (B) Copper levels measured by ICP-MS were significantly reduced in both patients. One-way ANOVA with Tukey’s multiple comparisons test: control versus Patient 1 (P < 0.0001), control versus Patient 2 (P < 0.0001).

